

Check your serial monitor output first—set the baud rate to match your code (typically 9600 or 115200) and add Serial.println() statements at key points in your program to track where execution stops or values go wrong. This simple technique reveals 80% of common Arduino issues within minutes.
Isolate the problem by commenting out sections of code and testing incrementally. Start with a minimal working example, then add functionality piece by piece until the error reappears. This methodical approach quickly identifies whether issues stem from hardware connections, library conflicts, or logic errors in your code.
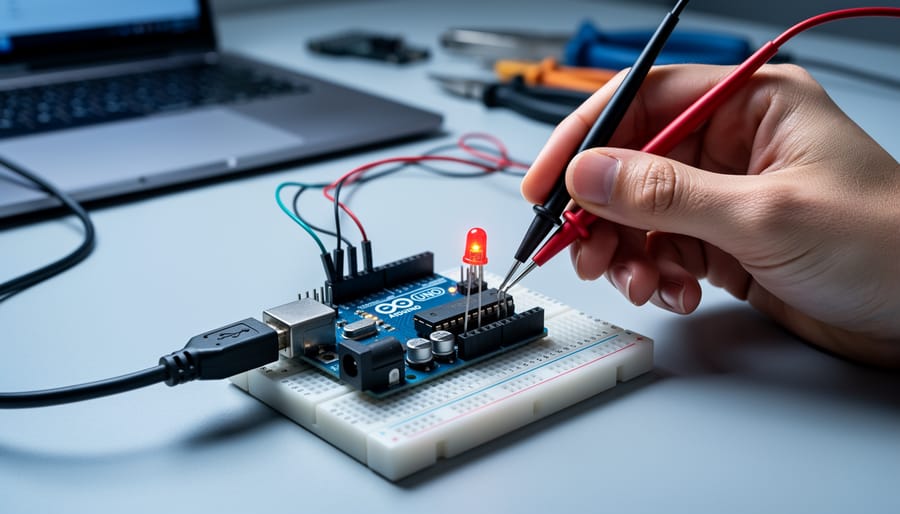
Verify your hardware connections using a multimeter to check continuity and voltage levels. Loose jumper wires, incorrect pin assignments, and inadequate power supplies cause countless headaches. Test each sensor and component individually with simple example sketches before integrating them into complex projects.
Upload the bare minimum blink sketch to confirm your board and USB connection work correctly. If even basic code fails, you’re dealing with bootloader corruption, driver issues, or board selection errors in the IDE—not problems with your actual project code.
Debugging Arduino projects doesn’t require expensive tools or advanced programming knowledge. The techniques above solve most issues faster than spending hours reading documentation. Whether you’re troubleshooting a temperature sensor that returns nonsensical values or motors that won’t respond to commands, systematic debugging transforms frustrating failures into learning opportunities. This guide walks you through proven methods that professional makers use daily, from basic serial debugging to advanced automated testing approaches that prevent bugs before they occur.
Understanding Common Arduino Debugging Challenges
Hardware vs. Software Issues: Identifying the Culprit
When your Arduino project isn’t working as expected, the first step is identifying whether you’re dealing with a software bug or a hardware problem. This detective work can save you hours of frustration.
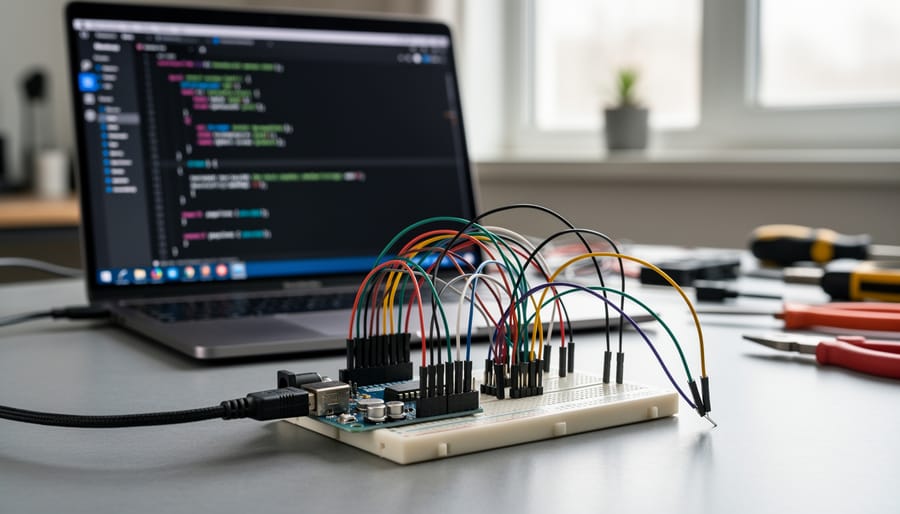
Start with the simplest checks first. Examine all physical connections carefully. Are your jumper wires securely seated in both the breadboard and Arduino pins? A loose connection is one of the most common culprits, yet easy to overlook. Gently wiggle each wire to test for stability.
Next, verify your power supply. Connect an LED directly to your power rails with an appropriate resistor. If it doesn’t light up, you’ve found your problem. Many Arduino sensor projects fail simply because sensors aren’t receiving adequate voltage.
To isolate software issues, try the swap-and-test method. Replace suspicious components with known working ones. If swapping a sensor fixes the problem, the hardware was faulty. If issues persist, your code likely needs attention.
Use the serial monitor to your advantage. Add strategic Serial.println() statements throughout your code to track variable values and program flow. If your program freezes at a specific point, that’s usually a code issue. If readings are erratic or nonsensical, suspect your sensor or wiring.
Test components individually before integrating them. Upload simple example sketches from the Arduino IDE to verify each sensor works independently. This methodical approach quickly reveals whether problems originate in hardware or software, letting you focus your debugging efforts effectively.
The Serial Monitor: Your First Line of Defense
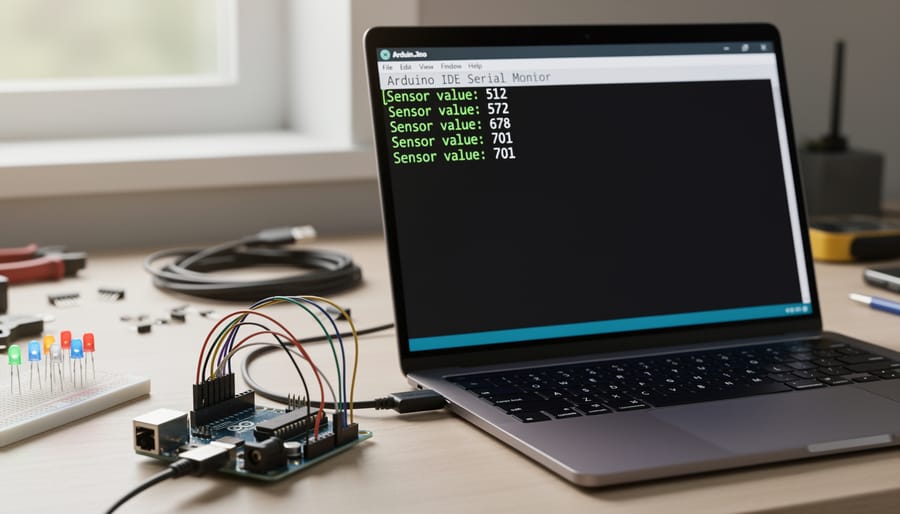
When your Arduino project isn’t behaving as expected, the Serial Monitor becomes your most valuable debugging companion. This built-in tool allows you to peek inside your running program, revealing what’s happening in real-time without requiring any additional hardware.
Think of Serial.print() statements as breadcrumbs that trace your program’s journey. To get started, initialize serial communication in your setup() function with Serial.begin(9600). The number 9600 represents the baud rate, which is the speed of communication between your Arduino and computer. Once initialized, you can send messages to the Serial Monitor from anywhere in your code.
The basic Serial.print() function displays text without moving to a new line, while Serial.println() adds a line break after each message. This distinction matters when you’re tracking multiple values. For example, printing “Temperature: ” followed by a sensor reading on the same line creates cleaner, more readable output than having them appear separately.
Use descriptive labels when printing variable values. Instead of just printing numbers, write Serial.print(“Loop count: “); Serial.println(counter); This context helps you quickly identify which value you’re examining, especially when monitoring multiple variables simultaneously.
Strategic placement of print statements reveals program flow issues. Add messages at the beginning of functions, inside conditional statements, and within loops to verify your code executes in the expected order. If you never see a particular message appear, you’ve discovered that section of code isn’t running.
For time-sensitive debugging, include timestamps using millis() to track how long operations take. This technique helps identify bottlenecks causing delays or unexpected timing issues. Remember to remove or comment out excessive print statements once debugging is complete, as they can slow down program execution significantly.
Essential Arduino Debugging Techniques
Strategic Serial Debugging
Once you’re comfortable with basic serial output, it’s time to level up your debugging game with strategic techniques that make problem-solving much easier.
Start by implementing timestamp logging to track when events occur in your code. Add `unsigned long timestamp = millis();` at the beginning of your loop, then include it in your serial prints: `Serial.print(timestamp); Serial.print(” ms – Sensor reading: “); Serial.println(value);`. This helps you identify timing issues, delays, or unexpected pauses in program execution.
Formatting your output makes it dramatically more readable, especially when debugging multiple variables simultaneously. Use tabs (`\t`) to create columns: `Serial.print(“Temp:\t”); Serial.print(temp); Serial.print(“\tHumidity:\t”); Serial.println(humidity);`. For cleaner output, consider adding separator lines between readings or using consistent spacing that aligns values vertically.
Conditional debug statements prevent your serial monitor from becoming overwhelming with information. Create a debug flag at the top of your sketch: `const bool DEBUG = true;`. Then wrap your debug prints in if statements: `if(DEBUG) { Serial.println(“Entering main loop”); }`. This lets you easily toggle debugging on or off without removing code.
For more advanced scenarios, implement debug levels. Define constants like `DEBUG_ERROR = 1`, `DEBUG_INFO = 2`, and `DEBUG_VERBOSE = 3`, then only print messages matching your current debug level. This gives you granular control over output detail without cluttering your code with endless print statements you’ll need to delete later.
LED Indicators for Quick Visual Feedback
LEDs are your best friend when you can’t connect to a computer or need quick visual feedback during program execution. Every Arduino board comes with a built-in LED connected to pin 13, making it perfect for basic debugging without any extra components.
Start simple by blinking the LED at different points in your code to confirm sections are executing. For example, a quick flash when entering a function tells you the code reached that point. You can create simple patterns too—two quick blinks might indicate successful sensor reading, while three slow blinks could signal an error condition.
Take this further by adding external LEDs to different pins, each representing a specific state. A green LED for normal operation, yellow for warnings, and red for errors creates an intuitive visual dashboard. This technique is especially valuable when debugging wireless projects or battery-powered devices where serial connections aren’t practical.
Here’s a practical tip: use different blink speeds to communicate values. A LED blinking slowly might indicate low battery, while rapid flashing could show high sensor activity. You can even create morse-code-like patterns to communicate error codes—count the flashes to identify which part of your code triggered the issue. This method works brilliantly for diagnosing problems in the field without hauling around a laptop.
Testing with Multimeters and Logic Analyzers
When your Arduino project misbehaves, sometimes the code is fine but the hardware isn’t cooperating. This is where test equipment becomes invaluable for tracking down issues.
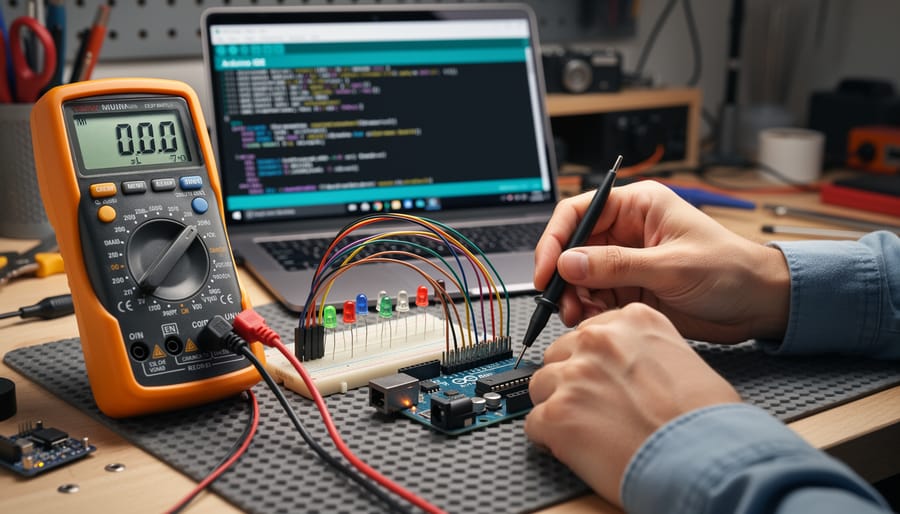
A digital multimeter is your first line of defense for hardware debugging. Start by verifying that your Arduino is receiving proper power. Set your multimeter to DC voltage mode and measure between the 5V pin and GND. You should see a steady 5V reading. If it’s significantly lower, you might have a power supply issue or a short circuit drawing too much current. Next, check the 3.3V pin, which should read close to 3.3V. These simple voltage checks can quickly reveal power-related problems before you spend hours questioning your code.
To verify that specific pins are working correctly, measure the voltage on digital pins while your code runs. A HIGH output should read approximately 5V (or 3.3V on 3.3V boards), while LOW should be near 0V. If you’re getting unexpected readings, you’ve found your culprit. For analog pins, you can measure the actual voltage being read by sensors to confirm they’re operating within expected ranges.
Logic analyzers take debugging further by capturing and displaying digital signals over time. These affordable devices connect to your Arduino pins and show you exactly what’s happening on multiple channels simultaneously. They’re particularly helpful for debugging communication protocols like I2C or SPI, where timing issues can cause mysterious failures. Most logic analyzers come with free software that decodes common protocols, making it easy to spot when data transmissions go wrong. You’ll see precisely where signals drop or timing becomes misaligned, turning guesswork into concrete evidence.
Isolating Problems with Code Segmentation
When your Arduino sketch becomes complex, isolating the problematic code becomes essential. Start by commenting out sections of your code using double slashes (//) for single lines or /* */ for blocks. This technique helps you identify which part is causing issues.
Begin with your most recently added code and work backwards. Comment out functions one at a time, then upload the modified sketch to see if the problem persists. If your Arduino suddenly works, you’ve found the culprit.
Break large sketches into smaller, manageable functions that you can test independently. For example, if you’re working on a sensor project, separate the sensor reading code from the display logic. Test each function with simple Serial.print() statements to verify it works correctly before combining everything.
Consider creating a minimal test sketch that includes only the problematic section plus basic Serial output. This stripped-down version makes it easier to spot logic errors or timing issues. For projects involving multiple communication protocols, this approach proves invaluable for 1-Wire communication debugging and similar technical challenges.
Remember to uncomment your code gradually, testing after each addition to pinpoint exactly where things break.
Setting Up Automated Testing for Arduino Projects
Unit Testing Arduino Code with AUnit
Unit testing transforms Arduino development from guesswork into a systematic process. The AUnit framework brings professional testing practices to your Arduino projects, helping you catch bugs before they reach your hardware.
Getting started with AUnit is straightforward. Open the Arduino IDE, navigate to Tools > Manage Libraries, and search for “AUnit”. Install the latest version by Brian T. Park. Once installed, you’ll have access to a lightweight testing framework specifically designed for Arduino’s resource constraints.
Let’s write your first test case. Create a new sketch and include the AUnit library at the top. Suppose you have a simple function that converts temperature from Celsius to Fahrenheit:
“`cpp
#include
float celsiusToFahrenheit(float celsius) {
return (celsius * 9.0 / 5.0) + 32.0;
}
test(temperatureConversion) {
assertEqual(32.0, celsiusToFahrenheit(0.0));
assertEqual(212.0, celsiusToFahrenheit(100.0));
assertEqual(98.6, celsiusToFahrenheit(37.0));
}
void setup() {
Serial.begin(9600);
while(!Serial);
}
void loop() {
aunit::TestRunner::run();
}
“`
Upload this sketch to your Arduino. Open the Serial Monitor, and you’ll see test results indicating which assertions passed or failed. Each assertEqual statement checks if your function produces the expected output.
For more complex projects, organize tests into separate files and test individual components like sensor readings or motor control functions. If a test fails, you’ve immediately identified the problematic function without needing to debug the entire system. This approach saves hours of frustration and makes your code more reliable and maintainable.
Simulation Testing Before Hardware Deployment
Before you risk damaging precious components or spending hours troubleshooting physical hardware, consider testing your Arduino code in a virtual environment. Simulation tools like Wokwi and Tinkercad Circuits offer free, browser-based platforms where you can build and test complete Arduino projects without touching a single wire.
These simulators provide visual representations of Arduino boards, breadboards, and common components like LEDs, sensors, and displays. You can write your code directly in the simulator, upload existing sketches, and watch your virtual circuit come to life in real-time. The best part? If something goes wrong, you simply reset the simulation rather than replacing a burnt-out component.
Wokwi stands out for its extensive component library and support for various Arduino boards, including the Uno, Mega, and Nano. It even simulates complex sensors and displays with remarkable accuracy. Tinkercad Circuits, part of Autodesk’s free design platform, offers an intuitive drag-and-drop interface perfect for beginners learning circuit design alongside coding.
Simulation testing proves especially valuable when working with projects involving Arduino data logging or complex sensor arrays. You can verify your logic, test edge cases, and experiment with different component configurations before committing to a physical build. This approach not only saves money but also builds confidence in your code’s functionality, allowing you to focus debugging efforts on genuine hardware-specific issues when you finally deploy to your actual Arduino board.
Introduction to CI/CD for Arduino Firmware
What CI/CD Means for Arduino Developers
If you’ve ever wished your Arduino code could be checked automatically before uploading it to your board, you’re thinking about Continuous Integration and Continuous Deployment, or CI/CD for short. While these terms might sound intimidating, the concept is straightforward and incredibly helpful for Arduino developers.
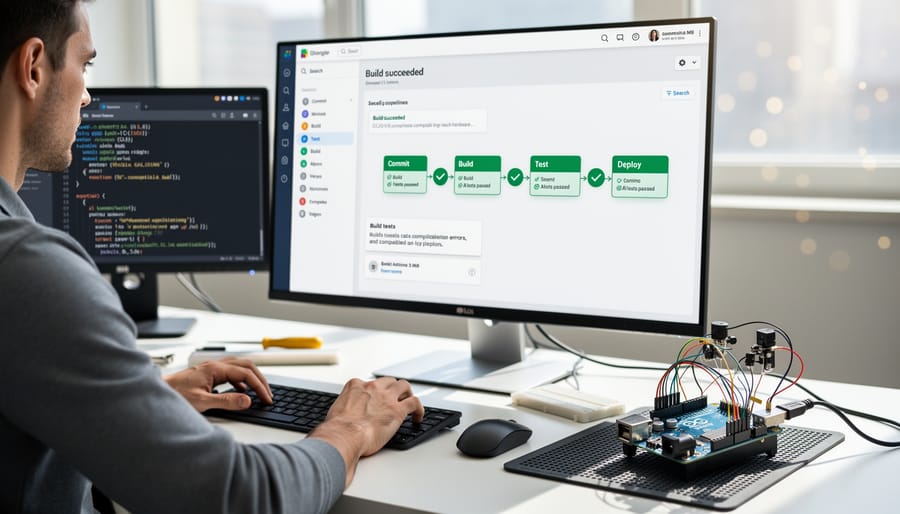
Think of CI/CD as your personal code assistant that works 24/7. Continuous Integration means automatically checking your code every time you make changes. Instead of discovering compilation errors when you’re ready to upload to your Arduino, CI systems catch these issues immediately. This is especially valuable when working on larger projects or collaborating with others.
Here’s how it works in practice: You write your Arduino sketch and push it to a version control system like GitHub. The CI system automatically compiles your code and runs basic checks, alerting you instantly if something won’t work. No more “but it worked on my computer” moments.
The deployment part ensures your tested code gets organized properly, with clear version numbers and documentation. For Arduino projects, this might mean automatically generating hex files ready for upload or packaging your libraries for distribution.
Version control benefits extend beyond just backup. You can track exactly when bugs were introduced, revert to working versions instantly, and experiment with new features without fear of breaking your main code. Tools like PlatformIO and GitHub Actions make implementing CI/CD surprisingly accessible, even for hobbyists just starting their automation journey.
Setting Up GitHub Actions for Arduino Projects
GitHub Actions provides a powerful way to automatically test your Arduino code before deployment, catching errors early and saving you from frustrating debugging sessions later. Think of it as having an automated assistant that checks your code every time you make changes – especially useful when working on complex Arduino robot projects.
To get started, you’ll need a GitHub repository containing your Arduino sketches. In your repository’s root directory, create a folder structure: .github/workflows/. Inside this folder, create a file called arduino-ci.yml.
Here’s a basic YAML configuration to automatically compile your Arduino sketches:
name: Arduino CI
on: [push, pull_request]
jobs:
build:
runs-on: ubuntu-latest
steps:
– uses: actions/checkout@v3
– name: Setup Arduino CLI
uses: arduino/setup-arduino-cli@v1
– name: Install Arduino AVR Core
run: arduino-cli core install arduino:avr
– name: Compile Sketch
run: arduino-cli compile –fqbn arduino:avr:uno ./your-sketch-folder
This configuration triggers on every code push and pull request. The workflow sets up the Arduino CLI (Command Line Interface), installs the necessary Arduino core for your board, and attempts to compile your sketch. If compilation fails, you’ll receive immediate feedback without needing to upload code to physical hardware.
Replace “arduino:avr:uno” with your specific board’s Fully Qualified Board Name (FQBN), and update the sketch path accordingly. For different boards like the Mega or Nano, check Arduino’s documentation for the correct FQBN.
Once committed, visit your repository’s Actions tab to monitor build results. Green checkmarks indicate successful compilation, while red X marks highlight compilation errors with detailed logs. This automated testing approach dramatically reduces debugging time by catching syntax errors, missing library dependencies, and compatibility issues before they reach your hardware.
Advanced Debugging Tools Worth Exploring
Using debugWIRE and JTAG Interfaces
When Serial.print() statements and LED blinks aren’t enough to track down stubborn bugs, hardware debugging interfaces offer a powerful alternative. Two primary interfaces allow professional-level debugging on Arduino-compatible boards: debugWIRE and JTAG.
Think of these interfaces as direct communication channels to your microcontroller’s brain. Unlike software debugging methods, hardware debugging lets you pause code execution at specific breakpoints, examine variable values in real-time, and step through your code line-by-line—just like debugging on a computer.
DebugWIRE is available on certain ATmega microcontrollers (like those in older Arduino boards) and uses a single wire for communication. It’s simpler but requires specialized programmers like the Atmel-ICE. JTAG (Joint Test Action Group) is more robust and common on ARM-based boards like the Arduino Due and many third-party Arduino-compatible boards. JTAG uses multiple pins but provides comprehensive debugging capabilities.
To use these interfaces, you’ll need compatible hardware debuggers—affordable options include J-Link EDU mini for JTAG or USBasp with debugWIRE support. You’ll also need software like Atmel Studio or PlatformIO with debugging extensions enabled.
The trade-off? These tools require initial setup and investment, but they dramatically reduce debugging time for complex projects. If you’re building larger systems with multiple sensors or intricate timing requirements, hardware debugging transforms frustrating guesswork into systematic problem-solving. While beginners can start with simpler methods, understanding these interfaces opens doors to professional-grade development workflows.
PlatformIO: A More Powerful Development Environment
If you’re finding the standard Arduino IDE limiting for debugging, PlatformIO offers a significant upgrade. This open-source ecosystem transforms Visual Studio Code into a comprehensive development environment with professional-grade debugging capabilities. Unlike the Arduino IDE’s reliance on serial print statements, PlatformIO provides true breakpoint debugging, allowing you to pause code execution and inspect variables in real-time.
PlatformIO excels at library management, automatically handling dependencies and version control—no more manual library installations or compatibility headaches. The intelligent code completion and syntax checking catch errors before uploading, saving you valuable time. Its built-in static analysis tools help identify potential bugs and memory issues, complementing your efforts in optimizing Arduino code.
The platform supports multiple boards and frameworks from a single interface, making it ideal if you work with various microcontrollers. While there’s a learning curve when transitioning from Arduino IDE, the investment pays off through faster development cycles and fewer mysterious bugs. PlatformIO’s unit testing framework also enables you to verify code functionality before deployment, particularly valuable for complex projects. For hobbyists ready to level up their debugging game, PlatformIO bridges the gap between beginner-friendly tools and professional development environments.
Your debugging journey with Arduino doesn’t have to be overwhelming. Starting with simple serial monitoring and progressing through hardware diagnostics, testing frameworks, and eventually automated CI/CD pipelines represents a natural learning curve that matches your growing expertise. The key is to begin where you are right now and build your skills incrementally.
If you’re just getting started, focus on mastering the basics. Learn to use Serial.print() effectively, understand how to interpret error messages, and get comfortable with multimeter measurements. These fundamental techniques will solve most of your immediate problems and build your confidence.
As you tackle more complex projects, gradually introduce systematic testing practices. Write simple unit tests for your functions, experiment with hardware-in-the-loop testing, and consider implementing continuous integration for projects you plan to maintain long-term. Each new technique you adopt makes the next debugging session a little easier.
Remember that debugging is a skill that improves with practice. Every error message you decipher, every faulty connection you trace, and every logic bug you fix makes you a better maker. Don’t get discouraged by setbacks. Instead, view each debugging challenge as an opportunity to deepen your understanding of how your Arduino projects actually work. Start simple, stay curious, and keep building.