

**Start logging data with Arduino by connecting a microSD card module to your board’s SPI pins, initializing the SD library in your sketch, and writing sensor readings to a .csv file every few seconds.** This approach transforms your Arduino into a portable data recorder capable of capturing temperature, humidity, pressure, light levels, or any measurable environmental condition without requiring constant computer connectivity.
Data logging projects solve real-world problems: tracking greenhouse conditions for optimal plant growth, monitoring vehicle performance metrics, recording weather patterns, or analyzing energy consumption in your home. The Arduino ecosystem excels at these tasks thanks to its low power consumption, compact size, and extensive sensor compatibility. Unlike computer-tethered setups, standalone data loggers can operate for days or weeks in remote locations, storing thousands of measurements on inexpensive SD cards.
The fundamental components you’ll need include an Arduino board (Uno, Nano, or Mega work perfectly), a microSD card module or shield, appropriate sensors for your application, and a reliable power source. Success depends on understanding three core concepts: sensor interfacing to capture accurate measurements, timestamp generation using RTC modules for chronological data, and efficient file handling to prevent data corruption during writing operations.
Whether you’re building your first temperature logger or designing a multi-sensor environmental monitoring station, Arduino’s flexibility and straightforward programming make data collection accessible to beginners while offering enough depth for advanced applications requiring custom sampling rates, data filtering, and conditional logging triggers.
What Is Data Logging and Why Use Arduino?
Data logging is the process of automatically collecting and storing information from sensors or instruments over time. Think of it as creating a digital notebook that records measurements—like temperature, humidity, light levels, or motion—without you having to manually write them down. This automated record-keeping lets you analyze trends, troubleshoot problems, and make data-driven decisions for your projects.
Arduino boards have become incredibly popular for data logging projects, and for good reason. First, they’re remarkably cost-effective—you can start logging data for under $25 with a basic Arduino Uno and a few components. Second, their low power consumption makes them ideal for remote or battery-powered applications where your logger might run for weeks or months. Third, Arduino’s versatility means you can connect virtually any sensor and customize your data collection to fit your exact needs.
For hobbyists and educators, Arduino-based data logging opens up countless practical applications. Home gardeners use Arduino to monitor soil moisture and automate watering systems. Weather enthusiasts build personal weather stations tracking temperature, humidity, and barometric pressure. Educators create engaging science experiments where students collect and analyze real environmental data. Energy-conscious users monitor power consumption to identify wasteful appliances. Even beekeepers use Arduino loggers to track hive conditions and protect their colonies.
The beauty of Arduino data logging lies in its accessibility. You don’t need an engineering degree to get started—just curiosity and willingness to learn. With straightforward programming and abundant community support, you’ll quickly move from collecting your first temperature reading to building sophisticated monitoring systems that solve real problems in your daily life.

Essential Components for Arduino Data Logging
Arduino Boards: Which One Fits Your Project?
Choosing the right Arduino board can make or break your data logging project. Let’s compare three popular options to help you decide.
The **Arduino Uno** is the go-to choice for beginners. With 2KB of SRAM and 32KB of flash memory, it handles basic logging tasks admirably. Its 14 digital pins and 6 analog inputs provide enough flexibility for sensors and SD card modules, though you’ll need to manage memory carefully for long-term projects.
Need something compact? The **Arduino Nano** offers nearly identical specs to the Uno but in a breadboard-friendly package. It’s perfect for portable data loggers where space is tight. The smaller form factor doesn’t sacrifice capability—you get the same 2KB SRAM and plenty of pins for essential sensors.
For ambitious projects, the **Arduino Mega** is your powerhouse. With 8KB of SRAM and 54 digital pins, it excels at logging multiple sensors simultaneously. This extra memory means longer data buffers and more complex code without running into storage limits.
**Power consumption** remains similar across all three boards (around 40-50mA during operation), so your choice ultimately depends on project complexity and physical space constraints. Start simple with an Uno, then upgrade if your project demands more resources.
Storage Options: SD Cards vs. EEPROM vs. Cloud
Choosing the right storage method for your Arduino data logging project depends on your specific needs, budget, and technical requirements. Let’s explore three popular options to help you make an informed decision.
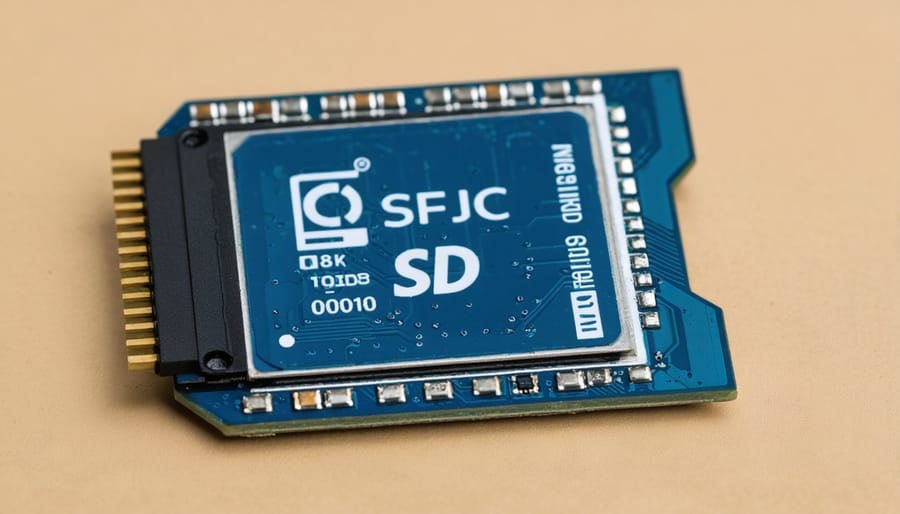
**SD Cards** offer the most storage capacity, typically ranging from a few gigabytes to 128GB or more. They’re perfect for projects requiring large amounts of data or high sampling rates. SD cards are removable, making data transfer to your computer straightforward—just pop it out and plug it into a card reader. The downside? They require additional hardware (an SD card module), consume more power, and add complexity to your code. Best for: weather stations, GPS trackers, and long-term environmental monitoring.
**EEPROM (Electrically Erasable Programmable Read-Only Memory)** is built directly into most Arduino boards, offering instant availability without extra components. It’s ideal for storing small amounts of critical data like sensor calibration values, configuration settings, or the last few readings. However, EEPROM has severe limitations: typically only 1-4KB of storage and a finite write cycle limit (around 100,000 writes). Best for: saving system settings, storing backup data, or logging infrequent events.
**Cloud storage** enables real-time data access from anywhere and automatic backups. Using WiFi or cellular shields, your Arduino can upload data to platforms like ThingSpeak or Google Sheets. This approach requires internet connectivity, consumes significant power, and involves ongoing costs for cellular data. Best for: remote monitoring applications, collaborative projects, or when real-time access is essential.
Sensors You Can Connect
Arduino opens up a world of environmental monitoring through various affordable sensors. Understanding what each sensor measures helps you choose the right components for your data logging project.
**Temperature sensors** like the DS18B20 or DHT22 measure ambient or surface temperatures in Celsius or Fahrenheit. They’re perfect for climate monitoring, greenhouse automation, or tracking server room conditions. The DHT22 combines temperature and **humidity sensing** in one package, recording moisture levels as percentages—ideal for weather stations or indoor air quality projects.
**Pressure sensors** such as the BMP280 detect atmospheric pressure in pascals or bars. Beyond weather forecasting, they can calculate altitude changes, making them valuable for altitude logging or drone applications.
**Light sensors** like photoresistors or the BH1750 measure illumination intensity in lux. Use them to track daylight patterns, automate lighting systems, or monitor plant growth conditions.
The beauty of connecting sensors to Arduino lies in their simplicity—most communicate through standard protocols like I2C or digital pins, requiring just a few wires and minimal coding. Start with one sensor to master the basics, then combine multiple sensors for comprehensive environmental monitoring.
Setting Up Your First Arduino Data Logger
Hardware Setup and Wiring
Getting your Arduino data logger up and running starts with proper connections. Don’t worry—this setup is beginner-friendly and requires just a few basic components.
**What You’ll Need:**
– Arduino board (Uno or Nano works great)
– SD card module
– MicroSD card (formatted to FAT32)
– Sensor of your choice (DHT22 for temperature/humidity is ideal for beginners)
– Jumper wires
– Breadboard (optional but recommended)
– USB cable for Arduino
**Connecting the SD Card Module:**
The SD card module communicates with your Arduino using SPI protocol. Here’s how to wire it:
– **CS (Chip Select)** → Arduino pin 10
– **SCK (Serial Clock)** → Arduino pin 13
– **MOSI (Master Out Slave In)** → Arduino pin 11
– **MISO (Master In Slave Out)** → Arduino pin 12
– **VCC** → Arduino 5V pin
– **GND** → Arduino GND pin
**Adding Your Sensor:**
For a DHT22 temperature sensor, the setup is straightforward:
– **VCC** → Arduino 5V
– **Data pin** → Arduino pin 2 (or any digital pin)
– **GND** → Arduino GND
Insert a 10kΩ pull-up resistor between the data pin and VCC for stable readings.
**Pro Tips:**
Always double-check your connections before powering up. Reversing power connections can damage components. Use a breadboard to make connections more manageable and allow easy troubleshooting. Ensure your SD card is properly formatted—Arduino libraries work best with FAT32 format for cards under 32GB.
Programming Your Data Logger
Now that your hardware is connected, let’s dive into the code that brings your data logger to life. We’ll break down each component so you can understand exactly what’s happening at every step.
**Initializing Your Sensors**
The setup begins by preparing your components to communicate with the Arduino. First, you’ll initialize the SD card module using `SD.begin(chipSelect)`, where chipSelect is the pin connected to your SD module’s CS pin. This tells the Arduino where to find your storage. Next, initialize your sensors—for example, a DHT temperature sensor requires `dht.begin()`. This wakes up the sensor and prepares it to send data. Don’t forget to initialize Serial communication with `Serial.begin(9600)` so you can monitor what’s happening during testing.
**Reading Data from Sensors**
Reading data is straightforward once initialization is complete. For a DHT sensor, you’d use `float temperature = dht.readTemperature()` and `float humidity = dht.readHumidity()`. Always include error checking with simple if-statements to verify the readings are valid—sensors occasionally return NaN (Not a Number) values if they misread.
**Formatting Timestamps**
Adding timestamps requires a Real-Time Clock module. After initializing with `rtc.begin()`, retrieve the current time using `DateTime now = rtc.now()`. Format it into a readable string like “2024-01-15 10:30:45” by combining `now.year()`, `now.month()`, `now.day()`, and time components with String concatenation.
**Writing to SD Card**
Finally, open a file on your SD card with `File dataFile = SD.open(“datalog.txt”, FILE_WRITE)`. If the file opens successfully, write your formatted data using `dataFile.println()`, combining your timestamp and sensor readings with commas for CSV format. Always close the file with `dataFile.close()` to ensure data saves properly. This complete cycle repeats in your loop function at whatever interval you specify with `delay()`.
Testing and Troubleshooting
Even experienced makers encounter challenges when starting with Arduino data logging. Here’s how to troubleshoot the most common issues you’ll face.
**SD Card Not Detected**: If your Arduino can’t find the SD card, first ensure it’s formatted as FAT32—other formats won’t work. Check that the card is fully inserted and that you’re using a quality card (Class 10 recommended). Verify your wiring connections, especially the CS (Chip Select) pin, which is typically connected to pin 10 but can be reassigned in code. Try a different SD card if problems persist, as some older or larger capacity cards have compatibility issues.
**Incorrect or Corrupted Data**: This usually stems from power instability or improper file handling. Always close files after writing data using `dataFile.close()` to ensure information is saved properly. If timestamps are wrong, verify your RTC module is configured correctly and has a functioning backup battery.
**Power Issues**: Data logging draws significant power, especially when writing to SD cards. If your Arduino resets randomly or behaves erratically, use an external power supply rather than USB power alone. A 9V adapter or battery pack with at least 500mA capacity should provide stable operation.
Test your setup incrementally—verify sensor readings first, then add SD card logging once sensors work correctly. This methodical approach makes identifying problems much easier.
Data Formats and Timestamps: Making Your Logs Useful
When logging data with your Arduino, choosing the right format makes all the difference between frustration and smooth analysis. Let’s explore the two most popular formats and how to add accurate timestamps to your data.
**CSV (Comma-Separated Values)** is the simplest format and perfect for beginners. Each line contains one reading with values separated by commas. Here’s an example:
“`
2024-01-15 14:30:22, 23.5, 65.2
2024-01-15 14:30:52, 23.7, 64.8
“`
This format opens directly in Excel or Google Sheets, making analysis straightforward. Use this Arduino code to create CSV logs:
“`cpp
Serial.print(timestamp);
Serial.print(“, “);
Serial.print(temperature);
Serial.print(“, “);
Serial.println(humidity);
“`
**JSON (JavaScript Object Notation)** offers more structure and is ideal for complex projects with multiple sensors. It’s self-documenting, making your data easier to understand months later:
“`json
{“time”:”2024-01-15 14:30:22″,”temp”:23.5,”humidity”:65.2}
“`
Implementing JSON is slightly more complex but worth it for larger projects. Consider using the ArduinoJson library to simplify formatting.
**Adding Timestamps with RTC Modules**
Arduino boards lack built-in real-time clocks, so they can’t track actual time when powered off. RTC modules like the DS3231 solve this problem with battery backup that maintains accurate time. Here’s a quick setup example using the RTClib library:
“`cpp
#include
RTC_DS3231 rtc;
void setup() {
rtc.begin();
rtc.adjust(DateTime(__DATE__, __TIME__));
}
void loop() {
DateTime now = rtc.now();
Serial.print(now.timestamp());
// Add your sensor readings here
}
“`
Set your timestamps in ISO 8601 format (YYYY-MM-DD HH:MM:SS) for universal compatibility across analysis tools. This standardization becomes crucial when securing your IoT data and sharing logs between different systems.
For battery-powered projects, consider logging Unix timestamps (seconds since 1970) instead—they’re more compact and save precious storage space on SD cards.
Retrieving and Analyzing Your Logged Data
Once your Arduino has collected data, the real fun begins—transforming those raw numbers into meaningful insights. Let’s walk through the process of extracting and analyzing your logged data, even if you’ve never worked with data analysis before.
**Extracting Your Data**
The retrieval method depends on your storage solution. For SD card logging, simply remove the card from your Arduino and insert it into your computer’s card reader. Your CSV or TXT files should be readily accessible. If you’re using EEPROM storage, you’ll need to create a simple Arduino sketch that reads and prints the stored values to the Serial Monitor, which you can then copy and save as a text file.
**Importing into Analysis Tools**
Spreadsheet software like Microsoft Excel, Google Sheets, or LibreOffice Calc are perfect starting points for beginners. Open your CSV file directly, and the data should populate into columns automatically. If you’re working with tab-delimited or space-separated data, use the “Import” function and specify your delimiter.
For those wanting more advanced capabilities, consider free tools like Python with Pandas library or R Studio. These platforms offer powerful analysis features but have a steeper learning curve—start with spreadsheets first to understand your data structure.
**Creating Visualizations**
Visual representations make patterns immediately obvious. In your spreadsheet program, select your data columns and insert charts:
– **Line graphs** work beautifully for temperature, humidity, or any time-series data
– **Scatter plots** help identify correlations between two variables
– **Bar charts** compare discrete measurements across different time periods
Most spreadsheet tools offer chart customization—add axis labels, adjust colors, and include gridlines for clarity. Export these as images for documentation or sharing your project results.
**Identifying Patterns and Insights**
Look for trends in your visualizations. Does temperature spike at certain times? Are there unexpected dips in sensor readings that might indicate calibration issues? Calculate simple statistics like average, minimum, and maximum values using built-in spreadsheet functions (AVERAGE, MIN, MAX).
Set up conditional formatting to highlight outliers—values significantly different from the norm. This technique quickly reveals data anomalies that deserve closer investigation, whether they’re genuine phenomena or sensor errors requiring troubleshooting.
Remember, effective data analysis doesn’t require advanced statistics. Start simple, ask questions about what your data reveals, and let curiosity guide your exploration.
Power Management for Long-Term Data Logging
When your Arduino data logger needs to run for weeks or months on battery power, smart power management becomes essential. The good news? With a few strategic choices, you can extend battery life from days to potentially years.
**Understanding Sleep Modes**
Arduino’s built-in sleep modes are your first line of defense against power drain. Instead of running continuously at full power, your Arduino can enter deep sleep between measurements, consuming as little as 0.1mA compared to 50mA when active. The ATmega328P (used in Arduino Uno) offers several sleep modes—”Power-down” being the most efficient for data logging. Wake your board periodically using the watchdog timer or external interrupts to take readings, then return to sleep immediately.
**Choosing Power-Efficient Components**
Your sensor selection dramatically impacts power consumption. Opt for sensors with low standby current and the ability to power down completely between readings. For example, the DHT22 temperature sensor draws only 50µA in standby. Use MOSFETs to completely disconnect power-hungry components when not in use. Similarly, choose SD cards wisely—some consume significantly less power than others during write operations.
**Calculating Your Power Budget**
Start by measuring actual current draw in each state. If your Arduino sleeps for 55 seconds per minute (consuming 0.5mA) and wakes for 5 seconds (consuming 50mA), your average draw is approximately 4.7mA. A 2000mAh battery could theoretically run this setup for 425 hours (about 18 days). These power management techniques apply broadly across microcontroller projects.
**Solar Power Solutions**
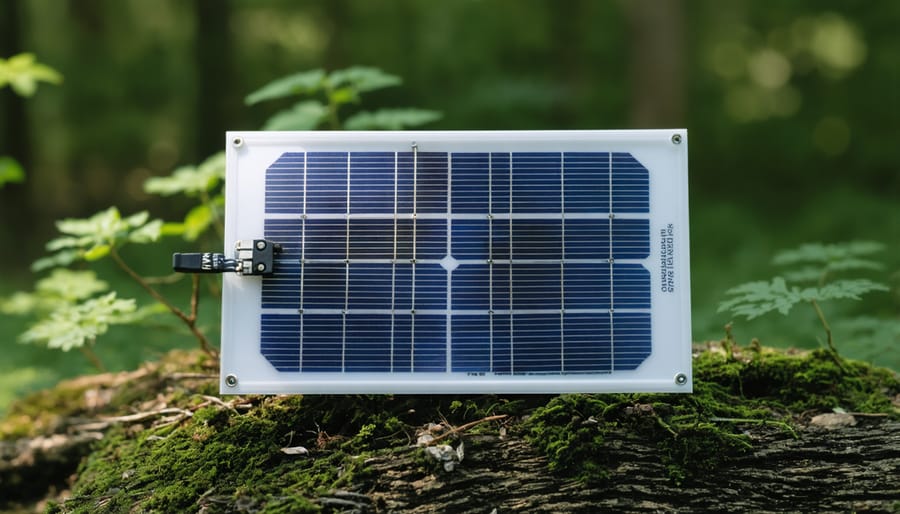
For outdoor installations, small solar panels (5-10W) paired with rechargeable lithium batteries create self-sustaining systems. Include a charge controller to prevent overcharging, and size your panel to generate at least twice your daily consumption to account for cloudy days.
Real-World Project Ideas to Try
Ready to put your Arduino data logging skills into action? Here are four exciting projects that demonstrate the practical power of data collection and analysis.
**Home Energy Monitor**: Track your household electricity consumption to identify energy-hogging appliances and reduce your bills. Use a non-invasive current sensor like the SCT-013 clamp sensor attached to your main power line, paired with an Arduino and SD card module. By logging voltage and current readings every few seconds, you’ll gain insights into usage patterns throughout the day and calculate your actual energy costs. You might discover that phantom loads from devices in standby mode are costing you more than expected!
**Garden Soil Moisture Tracker**: Keep your plants perfectly hydrated with a capacitive soil moisture sensor (like the DFRobot SEN0193) that logs moisture levels over time. Add a DHT22 sensor for temperature and humidity readings to understand how weather conditions affect soil moisture. This data helps you optimize watering schedules, prevent overwatering, and understand which plants need attention. You’ll quickly identify if your irrigation system is working efficiently or if certain garden areas dry out faster than others.
**Arduino weather station**: Build a comprehensive weather monitoring system using a BME280 sensor for temperature, humidity, and barometric pressure, plus a rain gauge and anemometer for precipitation and wind data. Log readings every 15 minutes to create your own hyperlocal forecast models. Over time, you’ll spot seasonal patterns and microclimates in your area that general weather apps miss completely.
**Aquarium Parameter Logger**: Maintain optimal conditions for aquatic life by monitoring water temperature (DS18B20 sensor) and pH levels (pH probe with amplifier module). Log data every hour to detect gradual changes that might stress your fish. This historical data helps you understand how feeding, water changes, and equipment affect water quality, making tank maintenance more predictable and preventing disasters.
Arduino vs. Raspberry Pi for Data Logging
When deciding between Arduino and Raspberry Pi for your data logging project, understanding each platform’s strengths helps you make the right choice for your specific needs.
**Power Consumption and Battery Life**
Arduino boards excel in low-power applications, consuming as little as 50-100 milliwatts during operation. This makes them ideal for remote sensors or solar-powered projects where every milliamp counts. You can run an Arduino on batteries for weeks or even months. Raspberry Pi, while more powerful, typically consumes 2-5 watts, limiting battery-based deployments to hours or days without substantial power sources.
**Simplicity and Real-Time Performance**
Arduino’s straightforward architecture shines when you need reliable, real-time data collection. There’s no operating system to crash or boot up—your code starts running immediately when powered on. This makes Arduino perfect for simple sensor readings, temperature monitoring, or environmental data collection. Raspberry Pi requires an operating system and boot time, but offers greater flexibility for complex projects.
**Processing Power and Storage**
If your project involves processing large datasets, image analysis, or running multiple simultaneous tasks, Raspberry Pi’s superior processing capabilities and built-in storage become invaluable. Arduino handles basic sensor data beautifully but struggles with computationally intensive operations or storing gigabytes of information.
**Cost Considerations**
Arduino boards typically cost $10-25, making them budget-friendly for multiple deployments. Basic Raspberry Pi models start around $35-45, though you’ll need additional accessories like SD cards and power supplies.
**The Bottom Line**
Choose Arduino for: simple sensor logging, battery-powered projects, real-time reliability, and cost-effective multiple deployments.
Choose Raspberry Pi for: complex data processing, large storage requirements, network connectivity, or projects needing multiple simultaneous sensors with advanced analysis.
Many advanced projects actually combine both platforms, using Arduino for reliable sensor data collection and Raspberry Pi for processing and storage.
You now have everything you need to start logging data with Arduino. Whether you’re monitoring temperature in your backyard, tracking humidity for a plant project, or collecting sensor data for a science experiment, Arduino makes data logging accessible and affordable. The beauty of Arduino lies in its simplicity—even complete beginners can set up a basic logging system in an afternoon, yet the platform is robust enough for professional environmental monitoring and scientific research.
Start small with a single sensor and an SD card module, then expand as you gain confidence. Don’t worry if your first project doesn’t work perfectly—troubleshooting is part of the learning process. The Arduino community is incredibly supportive, with countless forums, tutorials, and open-source code available to help you overcome any obstacle.
Remember that the skills you develop with Arduino data logging transfer beautifully to other platforms and more complex projects. You’re not just learning to log data—you’re building a foundation in electronics, programming, and problem-solving that will serve you well in future endeavors. Grab your Arduino board and start creating today!