
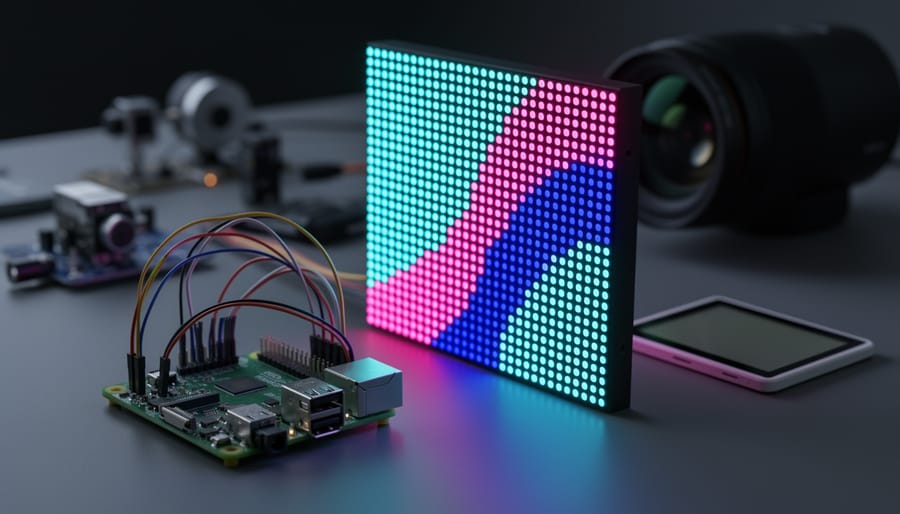
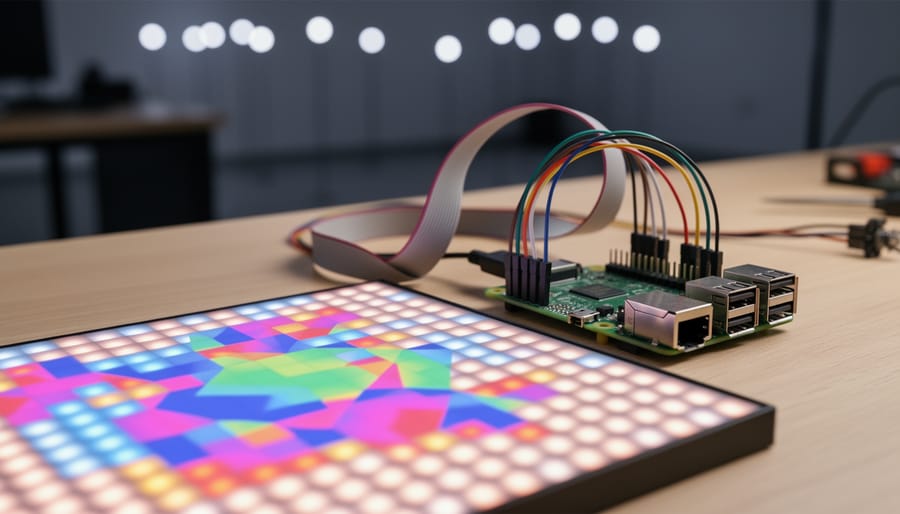
Transform your Raspberry Pi into a dynamic canvas by connecting it to LED matrices, e-paper displays, or projectors that visualize live data streams from weather APIs, social media feeds, or IoT sensors. Mount a 64×64 RGB LED panel directly to your Pi’s GPIO pins, install the rpi-rgb-led-matrix library, and write Python scripts that parse JSON data to generate animated patterns responding to real-time information like stock prices or environmental readings.
Leverage Processing, p5.js, or Python’s Pygame library to create generative artwork that evolves based on database queries, turning abstract data into compelling visual narratives perfect for interactive art installations. The Raspberry Pi’s low power consumption and compact form factor make it ideal for permanent gallery displays or public art pieces that run continuously without the bulk and energy demands of traditional computers.
Combine multiple data sources through MQTT protocols or REST APIs to drive complex visualizations—pull traffic patterns from city databases, aggregate sentiment analysis from Twitter streams, or map earthquake data to color gradients and motion parameters. Use libraries like Matplotlib for scientific visualizations, PIL for image manipulation, or OpenCV for computer vision-based reactive displays that change based on viewer proximity or movement.
Start with simple projects like displaying temperature data as color-shifting patterns, then progress to sophisticated installations featuring multiple synchronized displays, touchscreen interaction, or projection mapping. The Pi’s GPIO pins enable integration with physical sensors, buttons, and motors, allowing your data-driven artwork to extend beyond screens into kinetic sculptures and spatial installations.
Whether you’re creating museum-quality exhibits or weekend maker projects, the Raspberry Pi democratizes data visualization art by offering professional capabilities at hobbyist prices, backed by extensive community support and thousands of open-source examples to learn from and build upon.
What Makes Raspberry Pi Perfect for Data-Driven Art
Processing Power Meets Affordability
Modern Raspberry Pi models strike an impressive balance between computational capability and cost-effectiveness, making them ideal for data-driven art projects. The Raspberry Pi 4, for instance, offers quad-core processing at speeds up to 1.8GHz, coupled with up to 8GB of RAM. This processing muscle handles real-time data streams, executes visualization algorithms, and drives displays without breaking a sweat—all while costing under $75.
For artists new to physical computing, this affordability removes significant barriers to experimentation. You can purchase multiple units to create distributed installations or invest savings into quality displays, sensors, and materials. The Pi’s energy efficiency also matters for long-running installations, consuming just 3-7 watts compared to traditional computers that draw hundreds.
Python libraries like Matplotlib, Pygame, and Processing.py run smoothly on these boards, enabling complex generative graphics and data visualizations. The GPIO pins add another dimension, allowing your artwork to respond to environmental sensors, user interactions, or internet data feeds in real time. Whether you’re visualizing weather patterns, social media sentiment, or custom datasets, the Raspberry Pi delivers professional-grade results without requiring professional-grade budgets—making artistic innovation accessible to everyone from students to established creators.
GPIO and Sensor Integration
The Raspberry Pi’s GPIO (General Purpose Input/Output) pins are the gateway to transforming static artwork into dynamic, responsive installations. These 40 pins allow you to connect a wide array of sensors that collect real-world data, which can then influence your visual creations in real time.
Temperature and humidity sensors like the DHT22 provide environmental data that could control color palettes or animation speeds. Motion sensors (PIR sensors) detect viewer presence, making installations interactive and responsive to their audience. Light-dependent resistors (LDRs) measure ambient light levels, perfect for creating displays that adapt throughout the day. For more complex projects, distance sensors (ultrasonic or time-of-flight) can map viewer positions and proximity.
Connecting these sensors is straightforward. Most use either digital signals (reading HIGH or LOW states) or communicate via protocols like I2C or SPI, which the Pi supports natively. Python libraries such as RPi.GPIO and gpiozero simplify the coding process, letting you read sensor data with just a few lines of code.
The beauty of GPIO integration lies in its versatility. You can combine multiple sensors to create multi-layered artistic experiences. A weather-responsive installation might use temperature, humidity, and barometric pressure sensors simultaneously, translating atmospheric conditions into evolving visual patterns. This sensor-driven approach transforms your Raspberry Pi from a simple display controller into an intelligent system that bridges the physical and digital worlds.
Essential Hardware Components for Your Art Installation
Choosing the Right Raspberry Pi Model
Selecting the right Raspberry Pi model depends on your installation’s complexity and display requirements. For ambitious data-driven art projects with multiple animations, live data feeds, and high-resolution displays, the Raspberry Pi 4 (4GB or 8GB RAM) offers the processing power you need. Its dual micro-HDMI ports support dual 4K displays, making it ideal for gallery installations or large-scale public displays.
The Raspberry Pi 3 B+ strikes a balance between performance and cost, handling moderate complexity projects with single HD displays effectively. It’s perfect for learning projects and small to medium installations that process data streams without intensive graphical rendering.
For minimalist installations or space-constrained projects, the Raspberry Pi Zero 2 W provides surprising capability in a compact form. While it won’t drive 4K displays or handle complex real-time visualizations, it excels at simple LED matrix displays, e-paper screens, or basic animations responding to sensor data. Its low power consumption makes it excellent for battery-powered portable installations.
Consider your data refresh rates too. Projects pulling live weather data every few minutes work fine on any model, while real-time stock market visualizations or audio-reactive displays benefit significantly from the Pi 4’s enhanced processing capabilities.
Display Options: From LED Matrices to Projectors
Your Raspberry Pi can drive an impressive range of display options for creating data-driven art installations. LED matrix displays are popular choices for vibrant, eye-catching installations, available in various sizes from small 8×8 grids to massive 64×64 panels that can be chained together for large-scale projects. E-ink displays offer a unique aesthetic with their paper-like appearance and ultra-low power consumption, perfect for slow-changing data visualizations like weather patterns or stock tickers. Traditional LCD screens provide high-resolution color displays ideal for detailed graphics and interactive installations, with touch-enabled versions adding user engagement possibilities. For large-scale installations, projectors connected via HDMI transform entire walls into dynamic canvases, though they require consideration of ambient light and projection distance. Each display type has distinct advantages: LED matrices excel at brightness and visibility, e-ink shines in readability and energy efficiency, LCDs offer versatility and resolution, while projectors maximize scale and impact. Your choice depends on your project’s environment, power requirements, and artistic vision.
Sensors and Data Collection Devices
The magic of data-driven art comes alive when you connect sensors to your Raspberry Pi. These devices transform environmental conditions into dynamic visual outputs that respond to the world around them.
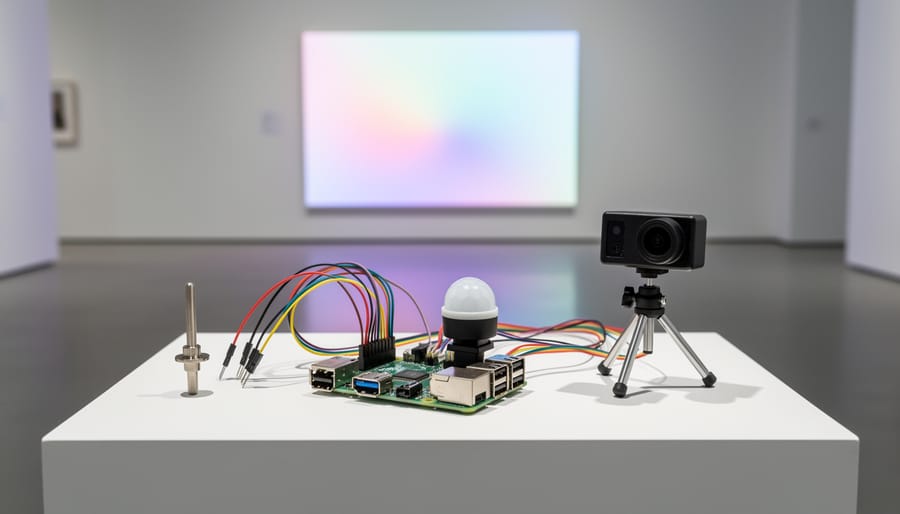
Motion sensors like the PIR (Passive Infrared) module detect movement, perfect for creating interactive installations that react when viewers approach. Temperature and humidity sensors (DHT11 or DHT22) capture climate data, enabling artwork that visualizes weather patterns or room conditions through color gradients or animated patterns.
Sound sensors measure ambient noise levels, allowing your drawings to pulse and flow with music or conversation. The MQ-series air quality sensors monitor particles and gases, making pollution or CO2 levels visible through real-time generative art.
Camera modules, including the official Raspberry Pi Camera and USB webcams, open possibilities for computer vision projects. Use them to detect colors, track objects, or analyze images to influence your artistic output.
Distance sensors like ultrasonic modules (HC-SR04) measure proximity, creating depth-responsive visualizations. Light sensors (LDR or photoresistors) track illumination changes, perfect for installations that adapt to day-night cycles.
Most sensors connect via GPIO pins and communicate through simple protocols like I2C or SPI. Many come with Python libraries that make data collection straightforward, even for beginners. Start with one sensor type, master its integration, then combine multiple inputs for increasingly complex and responsive artworks.
Popular Data Sources for Artistic Visualization
Environmental and Weather Data
Your Raspberry Pi can transform environmental data into captivating visual art that responds to the world around it. Start by connecting sensors like the DHT22 for temperature and humidity, or the BME680 for air quality monitoring. These plug directly into your Pi’s GPIO pins and provide instant readings.
For weather data, tap into free APIs like OpenWeatherMap or Weather Underground. With a few lines of Python code using the requests library, you’ll pull real-time conditions, forecasts, and atmospheric pressure. Display this data through dynamic drawings that change color palettes based on temperature ranges or animate patterns according to wind speed.
Air quality sensors like the PMS5003 add another dimension, letting your installation visualize pollution levels through particle density or color intensity. Combine multiple data streams for richer interactions—imagine artwork that shifts from cool blues during rain to warm oranges in sunshine, while simultaneously pulsing based on humidity levels. The Python libraries Adafruit_CircuitPython and matplotlib make data visualization straightforward, even for beginners. Start simple with one sensor, then expand your installation as you gain confidence with the hardware and code.
Social Media and Internet Data Streams
Social media and online data streams open exciting possibilities for creating dynamic, responsive art installations with your Raspberry Pi. By tapping into Twitter APIs, you can visualize real-time tweet sentiment, hashtag trends, or global conversation patterns as flowing colors or animated patterns. Instagram feeds offer rich visual data that can trigger drawing sequences based on color palettes extracted from recently posted photos.
Website traffic analytics provide another compelling data source. Imagine a display that pulses with activity whenever your site receives visitors, or draws geometric shapes based on visitor locations worldwide. You can use Python libraries like Tweepy for Twitter integration, and the official Instagram Graph API for feed access. For website data, Google Analytics API or simple server logs work excellently.
The key advantage is creating art that reflects our connected world in real-time. Your installation becomes a living visualization of digital activity, transforming abstract data streams into tangible visual experiences. Start with simple projects like displaying tweet counts as bar graphs, then progress to more complex visualizations that combine multiple data sources into intricate, evolving artworks that never repeat the same pattern twice.
Local Sensor Networks
The Raspberry Pi’s GPIO pins make it ideal for connecting sensors that create dynamic, responsive art installations. Motion sensors like the HC-SR501 PIR module can detect viewer presence, triggering visual changes as people approach your display. Sound level sensors such as the MAX4466 transform ambient noise or music into real-time visual patterns, perfect for interactive exhibits.
For tracking foot traffic patterns, combine ultrasonic distance sensors with simple Python scripts that log movement data throughout the day. Environmental sensors measuring temperature, humidity, or light levels add another dimension, allowing your artwork to reflect actual atmospheric conditions.
Start by connecting a single sensor to your Pi’s GPIO pins using a breadboard for testing. Libraries like gpiozero simplify sensor reading with just a few lines of code. Once you’ve captured data, feed it directly into your drawing script to modify colors, shapes, or animation speed. This approach transforms static visualizations into living installations that respond to their environment, creating unique experiences that change based on real-world interactions and conditions around them.
Software and Programming Tools for Raspberry Pi Art
Python Libraries for Data Visualization
Your Raspberry Pi becomes a powerful canvas when paired with the right Python libraries. Several excellent tools transform raw data into captivating visual displays, each with unique strengths for your creative projects.
Processing.py for visual art stands out as a beginner-friendly option, offering intuitive commands for creating dynamic graphics and animations. It excels at generative art and interactive visualizations, making it perfect for real-time data installations.
Matplotlib serves as your go-to library for statistical visualizations and graphs. While traditionally used for scientific plotting, creative makers have pushed it beyond conventional charts to generate artistic data representations. It works seamlessly with NumPy for handling complex datasets.
Pygame brings game development capabilities to data visualization, providing smooth animation and user interaction. Its sprite-based system makes it ideal for creating responsive installations that react to sensor inputs or live data streams.
For LED matrix displays, libraries like RGB Matrix and Sense HAT offer specialized functions to control pixel arrays, perfect for scrolling data visualizations or ambient information displays. These libraries handle the low-level hardware communication, letting you focus on creative output rather than technical details.
Alternative Programming Approaches
While Python dominates Raspberry Pi graphics projects, several alternative approaches cater to different skill levels and project requirements. Node.js offers JavaScript-based drawing capabilities through libraries like Canvas and p5.js, making it ideal for web developers transitioning to hardware projects. This approach excels when integrating real-time data from web APIs into visual displays.
For artists and musicians, Pure Data provides a visual programming environment perfect for generative art and interactive installations. Its patch-based interface lets you create complex graphics without traditional coding, connecting data inputs directly to visual outputs through draggable modules.
Node-RED stands out as the most beginner-friendly option, offering a browser-based flow editor that connects hardware, APIs, and visualization tools through simple drag-and-drop nodes. You can pull data from sensors or online sources and route it to dashboard gauges, charts, or custom graphics without writing a single line of code. This makes Node-RED particularly valuable for educators and hobbyists exploring data-driven art concepts before diving into programming languages.
Real-Time Data Processing Frameworks
For smooth, responsive data-driven visualizations on your Raspberry Pi, choosing the right real-time processing framework is essential. Node-RED offers a visual programming approach perfect for beginners, letting you connect data sources to display outputs through simple drag-and-drop nodes. It handles streaming data from APIs, sensors, and web services with minimal coding required.
For Python enthusiasts, libraries like asyncio enable concurrent data processing without blocking your visualization updates. Combine this with matplotlib’s animation functions or Pygame for fluid graphics that respond instantly to incoming data streams. When working with high-frequency data, consider lightweight frameworks like Flask with WebSocket support to push updates directly to browser-based visualizations.
The key is buffering your data appropriately—store recent values in memory to prevent bottlenecks while updating displays. Test your pipeline’s latency early to ensure your installation remains interactive and engaging for viewers.
Step-by-Step: Building Your First Data Art Installation
Project: Weather-Responsive LED Art Display
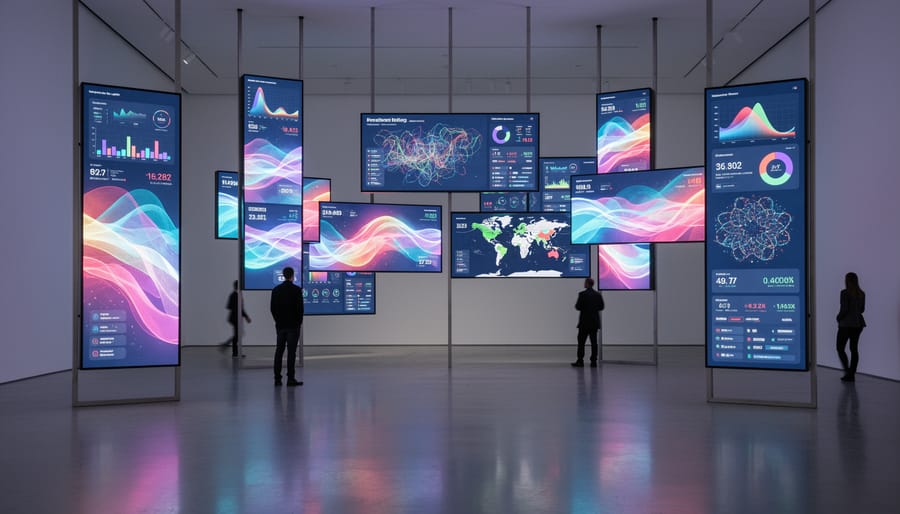
Let’s build something practical that combines coding, creativity, and real-time data. This weather-responsive LED art display transforms local weather information into dynamic visual patterns on an LED matrix controlled by your Raspberry Pi. When it’s sunny, the display might pulse warm yellows and oranges. During rain, cool blues cascade across the grid. The project pulls live weather data from online APIs, processes it with Python, and translates conditions into color patterns and animations. You’ll learn to connect an LED matrix to your Pi’s GPIO pins, fetch data from weather services, and write code that maps temperature, humidity, and conditions to visual effects. Before diving into hardware assembly, you can test your installation in a virtual environment. This beginner-friendly project demonstrates how data visualization becomes interactive art, creating an ambient display that’s both functional and beautiful.
Hardware Setup and Wiring
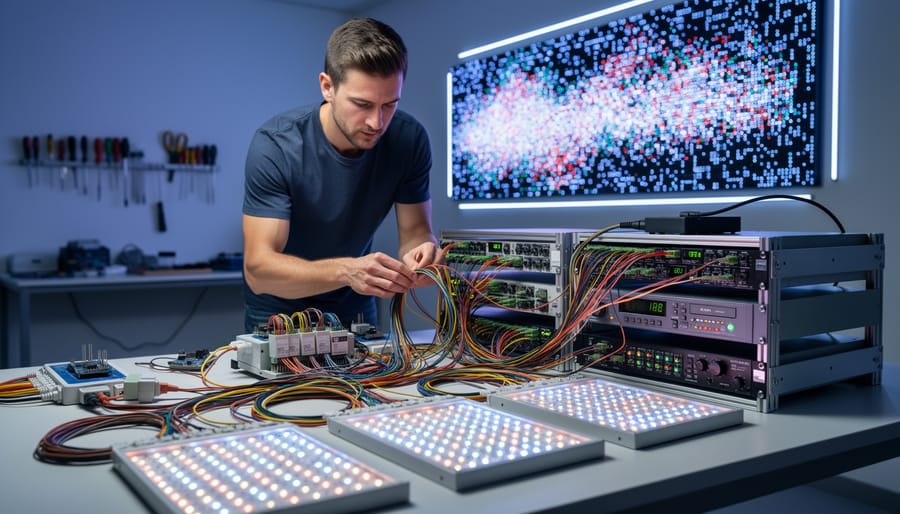
Connecting your display to the Raspberry Pi requires careful attention to wiring and power requirements. For LED matrix displays, you’ll typically use GPIO pins for data transmission. Start by powering down your Pi completely before making any connections.
Most LED matrices use SPI or I2C protocols. For a common 32×32 RGB LED matrix, connect the data pins to GPIO 10 (MOSI), clock to GPIO 11 (SCLK), and ground to any GND pin. Power requirements vary significantly—small displays can draw from the Pi’s 5V pin, but larger matrices need external power supplies to prevent voltage drops that could damage your board.
Always use a multimeter to verify voltage levels before connecting. A level shifter may be necessary if your display operates at 5V while the Pi’s GPIO pins output 3.3V. This prevents potential damage to your Raspberry Pi.
For safety, never connect or disconnect components while the system is powered. Use proper wire gauges—22 AWG works well for most connections. Consider using a breadboard initially for testing before soldering permanent connections. Label each wire clearly and take photos during assembly for troubleshooting reference.
Fetching and Processing Weather Data
Let’s walk through fetching weather data and transforming it into drawing parameters. First, sign up for a free API key from OpenWeatherMap or a similar service. Install the requests library on your Raspberry Pi using pip3 install requests to handle API calls.
Here’s a simple example that retrieves current temperature and converts it to color values:
“`python
import requests
import colorsys
API_KEY = “your_api_key_here”
CITY = “London”
url = f”http://api.openweathermap.org/data/2.5/weather?q={CITY}&appid={API_KEY}&units=metric”
response = requests.get(url)
data = response.json()
temp = data[‘main’][‘temp’]
# Convert temperature to hue (0-360)
hue = (temp + 20) / 60 # Maps -20°C to 40°C across color spectrum
rgb = colorsys.hsv_to_rgb(hue, 1.0, 1.0)
“`
This code maps temperature ranges to colors, creating warmer hues for higher temperatures. You can extend this approach by converting humidity to opacity, wind speed to line thickness, or precipitation levels to pattern density, giving your data-driven artwork meaningful visual representation.
Creating the Visual Display
Once you’ve set up your hardware and configured your display, it’s time to bring your data to life through code. Python’s Pygame library is perfect for creating dynamic visuals on the Raspberry Pi. Start by importing the necessary modules and initializing your display surface.
For basic shapes and patterns, use Pygame’s drawing functions like pygame.draw.circle() and pygame.draw.rect(). These can respond to incoming data by changing colors, sizes, or positions. For example, temperature readings might map to a color gradient from blue (cold) to red (hot) using RGB values.
Creating animations requires updating your display in a loop. Use pygame.time.Clock() to control frame rates and ensure smooth transitions. Data-driven animations work best when you map numerical values to visual properties. A simple approach is normalizing your data range to match pixel dimensions or color values (0-255).
For more complex visualizations, consider libraries like Matplotlib for graphs or PIL (Python Imaging Library) for image manipulation. You can generate charts in memory and display them on your screen, updating in real-time as new data arrives. Remember to handle screen clearing and buffer flipping to prevent visual artifacts and maintain clean, professional-looking displays.
Inspiring Examples of Raspberry Pi Art Installations
Real-world artists and makers have pushed the boundaries of what’s possible with Raspberry Pi, creating stunning installations that blend technology and creativity. These examples demonstrate how accessible hardware can produce professional-grade interactive art.
One remarkable project is the “Tate Modern’s Data Painting,” where a collective of artists used Raspberry Pi boards to visualize museum visitor flow patterns in real-time. The installation featured LED matrices that displayed flowing colors representing crowd density throughout the day. Each Pi collected data from motion sensors and transformed it into beautiful, ever-changing visual patterns projected onto gallery walls.
Another inspiring example comes from environmental artist Sarah Chen, who built “Breathing City” – an installation using six Raspberry Pi units to collect air quality data from different urban locations. The data drove servo motors that controlled hundreds of origami-like structures, which opened and closed based on pollution levels. When air quality was good, the structures bloomed; when pollution spiked, they contracted. This powerful visualization made invisible environmental data tangible and emotionally resonant.
The “Ocean Pulse” project by marine conservationists demonstrates Raspberry Pi’s potential for meaningful data art. Multiple Pi boards tracked real-time ocean temperature and acidity data, translating it into pulsating light installations that mimicked jellyfish movements. The faster and more intense the pulsing, the more concerning the ocean health metrics became, creating an immediate emotional connection with climate data.
For tech enthusiasts interested in social data, “Emotion Wall” stands out as an innovative example. This installation analyzed social media sentiment using natural language processing on Raspberry Pi clusters. The collective mood was displayed through dynamic color gradients on a large LED wall, shifting from warm hues during positive sentiment waves to cooler tones during negative trends.
These projects prove that Raspberry Pi isn’t just for hobbyists – it’s a legitimate tool for creating impactful, data-driven art that engages audiences and communicates complex information through visual storytelling.
Troubleshooting Common Challenges
Performance and Frame Rate Issues
Smooth visualizations require careful optimization of both code and hardware. Start by reducing your drawing complexity—simpler shapes and fewer simultaneous objects significantly improve frame rates. When working with real-time data, implement frame skipping by updating your display every 2-3 cycles rather than continuously, which maintains visual appeal while reducing processor strain.
For graphics libraries, choose lightweight options like Pygame Zero or consider hardware-accelerated alternatives. Enable GPU acceleration where possible by adjusting your Raspberry Pi’s memory split in the config.txt file, allocating at least 128MB to graphics processing.
Hardware-wise, adequate cooling prevents thermal throttling that degrades performance. Install heatsinks or small fans to maintain optimal temperatures during extended visualization sessions. If you’re running multiple data sources simultaneously, consider upgrading to a Raspberry Pi 4 with 4GB or 8GB RAM for better multitasking capabilities.
Monitor your system’s performance using the htop command to identify bottlenecks. Profile your code to pinpoint inefficient loops or redundant calculations, and cache frequently accessed data rather than recalculating it repeatedly. These adjustments ensure your data-driven art installations run smoothly without frustrating lag or stuttering displays.
Power Management for Long-Term Installations
For installations running 24/7, power stability is critical. Start with a quality power supply rated at least 3A for the Pi 4, as underpowered units cause corruption and random reboots. Use official Raspberry Pi power supplies when possible, as they’re designed to handle the board’s voltage requirements consistently.
Implement a proper shutdown procedure rather than pulling the plug. Enable read-only file systems for the root partition to prevent SD card corruption during unexpected power loss. Mount only necessary directories as writable, keeping your drawing code and data sources on separate, protected partitions.
Consider adding an uninterruptible power supply (UPS) designed for Raspberry Pi installations. These affordable add-on boards provide clean shutdown capabilities during outages, giving your Pi time to save states and power down gracefully. For critical installations, combine this with surge protection.
Monitor your system’s temperature and voltage using built-in tools. Set up automated alerts if voltage drops below 4.8V or temperatures exceed safe thresholds. Adding a small heatsink or fan ensures thermal stability during continuous operation, preventing throttling that could disrupt your real-time data visualizations. Finally, schedule regular automatic backups of your configuration and custom code to recover quickly from any failures.
The intersection of Raspberry Pi and data-driven art opens up a world of creative possibilities that’s more accessible than you might think. Whether you’re a seasoned maker or just starting your journey into creative technology, the low cost and versatility of the Raspberry Pi make it an ideal platform for bringing your artistic visions to life. The beauty of these projects lies in their scalability—you can start with something simple like a temperature-responsive LED display and gradually expand into complex, multi-sensor installations that transform entire spaces.
What makes this field particularly exciting is the active community surrounding Raspberry Pi projects. When you encounter challenges or need inspiration, countless forums, tutorials, and open-source examples are available to guide you forward. The skills you develop through these projects—whether learning Python, understanding sensor integration, or working with APIs—extend far beyond art installations and can enhance your overall technical capabilities.
Now is the perfect time to start your own data-driven art project. Begin by identifying a data source that resonates with you personally, whether that’s weather patterns, social media trends, or environmental sensors. Sketch out a simple visualization concept, gather the basic hardware components, and dive in. Remember, even professional installations started as small experiments. Don’t worry about creating something perfect on your first attempt; focus on learning the fundamentals and letting your creativity guide the technical implementation. The combination of accessible hardware, abundant learning resources, and your unique creative perspective is all you need to transform data into compelling visual experiences.