

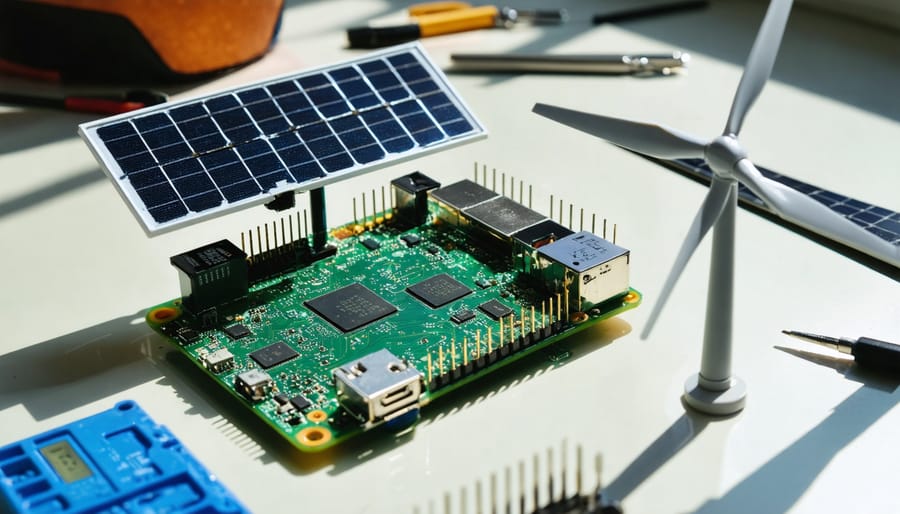
Harness the power of renewable energy monitoring with your Raspberry Pi’s edge computing capabilities to create a sustainable, data-driven ecosystem. From solar panels to wind turbines, renewable energy sources are revolutionizing how we power our world, and your Raspberry Pi can be at the heart of this transformation. This guide walks you through five essential renewable energy resources you can monitor and optimize using simple GPIO sensors, real-time data collection, and custom Python scripts.
Whether you’re a maker looking to reduce your carbon footprint or an educator teaching sustainable technology, these renewable energy monitoring solutions offer practical, hands-on experience with both environmental science and IoT applications. Our step-by-step approach combines hardware setup tutorials with ready-to-use code snippets, ensuring you can start collecting meaningful energy data within hours.
Learn how to transform your Raspberry Pi into a powerful renewable energy monitoring station that tracks solar efficiency, wind patterns, hydroelectric generation, biomass conversion, and geothermal activity – all while storing and analyzing data for optimal energy management.
Solar Power Monitoring System
Hardware Setup
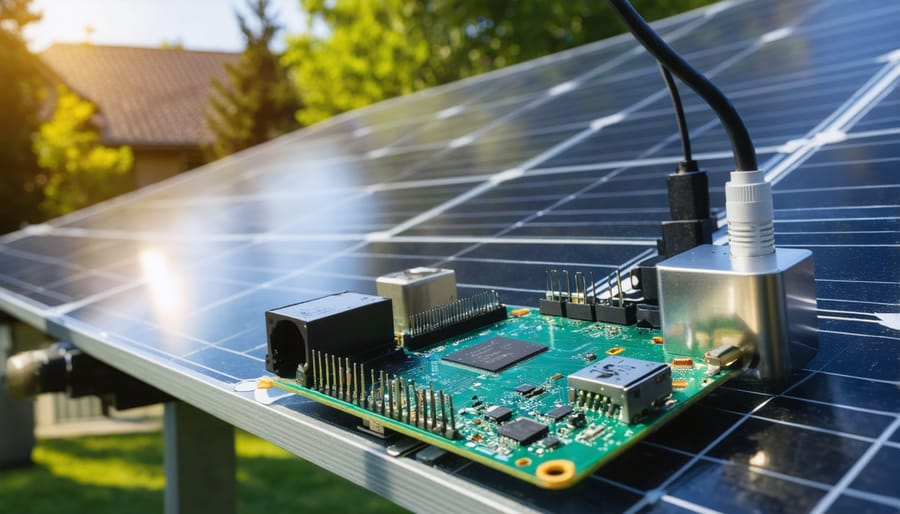
To build an effective renewable energy monitoring system, you’ll need several key components working together with your Raspberry Pi. For solar-powered Raspberry Pi systems, start with a Raspberry Pi 4B or newer model for optimal performance. Essential components include:
– Solar charge controller (30A recommended)
– Solar panel (minimum 100W)
– Deep cycle battery (12V, 100Ah)
– Voltage sensors (0-25V DC)
– Current sensors (ACS712)
– ADC converter (ADS1115)
– Weather-resistant enclosure
– Jumper wires and headers
Connect the voltage sensor to the ADC converter using channels A0 and A1, then wire the ADC to your Pi’s I2C pins (GPIO 2 and 3). The current sensor should be connected in series with your power line, with its output going to channel A2 on the ADC.
For wind monitoring, add an anemometer connected to GPIO pin 14. Temperature and humidity tracking requires a DHT22 sensor on GPIO pin 4. Mount all components securely in your weather-resistant enclosure, ensuring proper ventilation while maintaining protection from the elements.
Ground all connections properly and double-check your wiring before powering up the system. For optimal performance, position your solar panel facing south at a 30-45 degree angle, depending on your latitude.
Software Implementation
Here’s a simple Python script that demonstrates how to collect and process solar panel data using a Raspberry Pi. This code uses the ADS1115 analog-to-digital converter to measure voltage and current from your solar setup:
“`python
import time
import board
import busio
import adafruit_ads1x15.ads1115 as ADS
from adafruit_ads1x15.analog_in import AnalogIn
# Initialize I2C bus and ADC
i2c = busio.I2C(board.SCL, board.SDA)
ads = ADS.ADS1115(i2c)
# Configure input channels
voltage_channel = AnalogIn(ads, ADS.P0)
current_channel = AnalogIn(ads, ADS.P1)
def calculate_power():
voltage = voltage_channel.voltage * 5 # Scale factor for voltage divider
current = current_channel.voltage / 0.1 # Using 0.1 ohm shunt resistor
power = voltage * current
return voltage, current, power
while True:
v, i, p = calculate_power()
print(f”Voltage: {v:.2f}V”)
print(f”Current: {i:.2f}A”)
print(f”Power: {p:.2f}W”)
time.sleep(5)
“`
To store the collected data, you can extend this script to save readings to a SQLite database:
“`python
import sqlite3
conn = sqlite3.connect(‘solar_data.db’)
cursor = conn.cursor()
cursor.execute(”’CREATE TABLE IF NOT EXISTS readings
(timestamp TEXT, voltage REAL, current REAL, power REAL)”’)
# Add to main loop:
cursor.execute(“INSERT INTO readings VALUES (?, ?, ?, ?)”,
(time.strftime(‘%Y-%m-%d %H:%M:%S’), v, i, p))
conn.commit()
“`
Remember to install required libraries using: `pip install adafruit-circuitpython-ads1x15`

Wind Energy Tracking Solution
Sensor Integration
Accurate wind data collection is crucial for monitoring renewable energy potential, and setting up proper sensors is the first step. The anemometer, which measures wind speed, should be mounted on a sturdy pole at least 33 feet (10 meters) above ground level to avoid turbulence from nearby obstacles. Most digital anemometers use cup-style sensors that rotate with the wind, converting rotational speed into wind velocity measurements.
For wind direction sensing, a wind vane equipped with a digital encoder provides precise directional data. The sensor typically outputs values between 0 and 360 degrees, with 0/360° representing true north. When connecting these sensors to your Raspberry Pi, use shielded cables to minimize electromagnetic interference and ensure accurate readings.
To integrate both sensors, connect them to your Pi’s GPIO pins through an analog-to-digital converter (ADC) if they output analog signals. Many modern sensors communicate via I2C or SPI protocols, which the Pi natively supports. Remember to implement a sampling rate of at least once per second to capture wind gusts and rapid direction changes.
For optimal results, consider using a weather-resistant junction box to house the connections and protect them from the elements. Regular calibration checks against known reference points will help maintain accuracy over time. This setup provides essential data for evaluating wind energy potential and optimizing turbine placement.
Data Visualization
Creating effective wind energy data visualizations using Raspberry Pi involves setting up interactive dashboards that transform raw sensor data into meaningful insights. By leveraging popular visualization libraries like Grafana or Node-RED Dashboard, you can build comprehensive IoT monitoring solutions that display real-time wind speed, direction, and power generation metrics.
To get started, install Grafana on your Raspberry Pi and configure it to connect with your wind sensor database. Create custom panels that showcase different aspects of your wind energy data, such as:
– Line graphs displaying wind speed trends over time
– Gauge visualizations for current power output
– Wind rose diagrams showing predominant wind directions
– Heat maps indicating peak generation periods
– Historical performance comparisons
Consider implementing alert thresholds to notify you when wind conditions are optimal for energy generation or when maintenance might be required. Use color-coding to make your dashboards intuitive – for example, green for optimal conditions and red for underperformance.
For better accessibility, ensure your dashboard is mobile-responsive and can be accessed remotely through a web browser. This allows you to monitor your wind energy system from anywhere, making it easier to maintain and optimize your renewable energy setup.
Remember to include export options for your data visualizations, enabling you to generate reports and analyze long-term trends in your wind energy production.
Hydroelectric Power Monitoring
Flow Sensor Setup
Installing water flow sensors is crucial for monitoring hydroelectric power generation efficiency. Begin by selecting a compatible flow sensor, such as the YF-S201 or similar hall-effect sensor, which can measure water flow rates between 1-30L/min. Mount the sensor inline with your water supply pipe, ensuring the arrow on the sensor matches the direction of water flow.
Connect the sensor’s red wire to the Raspberry Pi’s 5V pin, the black wire to ground, and the yellow signal wire to a GPIO pin (typically GPIO17). Secure all connections using heat shrink tubing or electrical tape to protect against moisture.
For accurate readings, install the sensor in a straight section of pipe, at least 6 inches away from any bends or joints. This prevents turbulence from affecting measurements. Use thread seal tape on the sensor’s connections to prevent leaks.
Configure your Raspberry Pi to read the sensor by counting pulses – each rotation of the sensor’s internal paddle wheel generates approximately 450 pulses per liter. Implement a simple Python script to calculate flow rate based on pulse frequency, which can then be integrated into your renewable energy monitoring system.
Power Output Tracking
Tracking power output from hydroelectric generators is crucial for monitoring system efficiency and optimizing performance. Using a Raspberry Pi with appropriate sensors, you can create a reliable monitoring system that records and analyzes power generation data in real-time. Connect a current sensor and voltage divider to your generator’s output, then wire these to the Pi’s GPIO pins through an analog-to-digital converter (ADC).
The Pi can collect readings every few seconds, calculating instantaneous power output by multiplying current and voltage measurements. Store this data in a local database or send it to cloud storage for long-term analysis. You can visualize generation patterns using tools like Grafana or create custom dashboards with Python libraries like Matplotlib.
Set up automated alerts for when power output falls below expected levels, indicating potential issues with water flow or generator efficiency. This monitoring system helps identify maintenance needs early and provides valuable insights into your hydroelectric system’s performance across different seasons and weather conditions.
Consider adding environmental sensors to track water flow rates and reservoir levels alongside power output for a more comprehensive understanding of your system’s efficiency.
Biomass Energy Management
Temperature Monitoring
Temperature monitoring is crucial for optimizing biomass system performance and ensuring safe operation. The ideal setup involves strategically placed DS18B20 temperature sensors connected to your Raspberry Pi’s GPIO pins. These waterproof digital sensors are perfect for measuring temperatures in various parts of the biomass system, from the combustion chamber to the water storage tanks.
To implement this monitoring system, connect multiple DS18B20 sensors in parallel using the one-wire protocol on GPIO pin 4. Each sensor has a unique serial number, allowing you to track multiple temperature points simultaneously. The Raspberry Pi can easily read these sensors using Python libraries like w1thermsensor.
For comprehensive monitoring, place sensors at the biomass fuel input, combustion chamber, heat exchanger, and output pipework. Set up temperature thresholds in your monitoring software to trigger alerts when readings fall outside safe operating ranges. This helps prevent system damage and maintains optimal efficiency.
The data collected can be displayed on a web interface using frameworks like Flask or Django, enabling real-time monitoring and historical trend analysis. Regular temperature monitoring helps identify maintenance needs and optimize fuel consumption, making your biomass system more efficient and cost-effective.
Efficiency Calculations
When measuring biomass energy conversion efficiency, it’s crucial to monitor both input material and output energy. A Raspberry Pi can be configured to track key metrics like moisture content, feedstock volume, and energy output in real-time. By connecting temperature sensors at various points in the conversion process, you can calculate thermal efficiency and identify potential heat losses.
For optimal biomass conversion, aim for moisture content between 10-20% and maintain consistent feedstock quality. The conversion efficiency typically ranges from 20-40% for direct combustion systems and can reach up to 80% in combined heat and power (CHP) applications.
You can use your Raspberry Pi to calculate the net energy ratio (NER) by dividing the energy output by the energy input, including processing and transport energy. A Python script can automate these calculations and generate daily efficiency reports. Key performance indicators to monitor include:
– Combustion temperature (optimal range: 800-1000°C)
– Oxygen levels in exhaust gases
– Ash content percentage
– Energy output per kilogram of feedstock
Regular monitoring and adjustment of these parameters can help maintain peak system efficiency and maximize energy production from your biomass resources.
Geothermal System Integration
Temperature Differential Monitoring
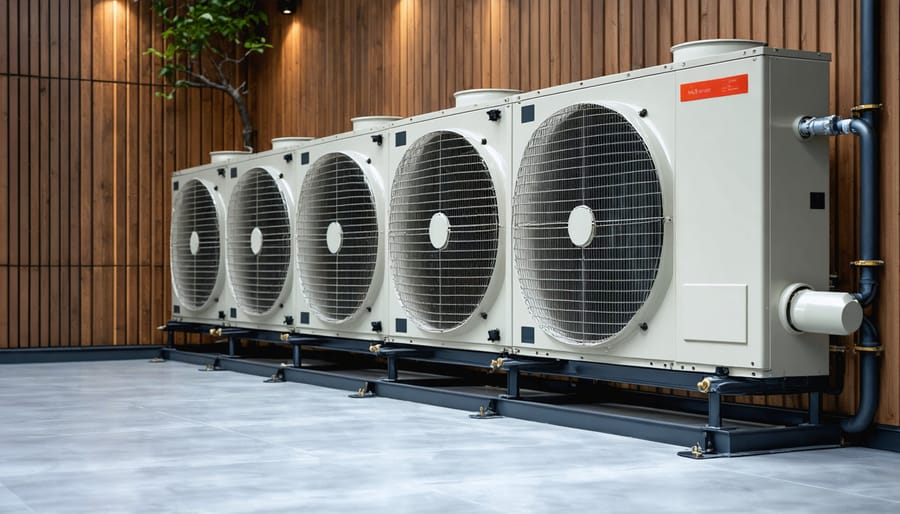
Temperature differential monitoring plays a crucial role in maximizing the efficiency of renewable energy systems. By tracking the temperature differences between various components, you can optimize heat exchange processes and improve overall system performance. Using a Raspberry Pi with DS18B20 temperature sensors, you can create a robust monitoring system that measures heat differentials across solar thermal collectors, geothermal systems, or waste heat recovery units.
The setup involves connecting multiple temperature sensors at different points in your system – typically at the heat source, transfer medium, and output locations. Python scripts can collect real-time temperature readings, calculate differentials, and trigger alerts when efficiency drops below optimal levels. This data helps identify heat loss points and maintenance needs before they become critical issues.
For maximum accuracy, consider implementing a rolling average calculation to smooth out temperature readings and account for environmental factors. By logging this data over time, you can analyze seasonal patterns and make informed decisions about system adjustments, ultimately improving your renewable energy setup’s performance and longevity.
Performance Analytics
Monitoring and optimizing renewable energy systems requires sophisticated data analysis tools, and the Raspberry Pi excels at this task. By implementing machine learning for performance analytics, you can track crucial metrics like energy production efficiency, consumption patterns, and system health in real-time.
Key performance indicators include power output measurements, temperature monitoring, and conversion efficiency rates. Using sensors connected to your Pi, you can collect data points every few seconds and store them in a local database. This information helps identify peak production times, predict maintenance needs, and optimize system placement.
The Pi’s GPIO pins can interface with various sensors to monitor voltage, current, and environmental conditions. Popular monitoring solutions include Node-RED for data visualization and InfluxDB for time-series data storage. These tools create comprehensive dashboards that display system performance metrics and generate automated alerts when parameters fall outside optimal ranges.
For maximum efficiency, implement automated adjustment systems that respond to real-time data, such as solar panel positioning or wind turbine blade pitch control. This creates a smart, self-optimizing renewable energy system that adapts to changing conditions.
The Raspberry Pi’s versatility in monitoring renewable energy sources opens up exciting possibilities for both hobbyists and professionals. By implementing these monitoring systems, users can optimize their energy production, reduce costs, and contribute to a more sustainable future. The low cost and high adaptability of the Raspberry Pi make it an ideal platform for expanding renewable energy projects, from small home installations to larger community initiatives. As renewable technology continues to advance, the potential applications for Raspberry Pi in this field will only grow, enabling more sophisticated monitoring, improved efficiency, and innovative solutions for sustainable energy management. Whether you’re just starting or looking to expand your existing setup, the Raspberry Pi provides an accessible and powerful tool for engaging with renewable energy technologies.