


Transform your Raspberry Pi into a powerful biomass energy monitoring station by harvesting and analyzing organic waste conversion data in real-time. This innovative project combines renewable energy monitoring with practical IoT applications, enabling precise tracking of biomass fuel efficiency and environmental impact.
Biomass energy projects represent a crucial intersection between sustainable resource management and modern technology. By leveraging the Raspberry Pi’s versatile computing capabilities, we can create sophisticated monitoring systems that measure everything from feedstock composition to energy output levels. This project not only demonstrates the practical applications of green computing but also provides valuable insights into renewable energy generation at a micro-scale.
Our step-by-step guide transforms complex biomass monitoring concepts into an accessible DIY project, perfect for both beginners and experienced makers. The system we’ll build captures critical data points including temperature variations, moisture content, and conversion efficiency rates, making it an ideal platform for understanding and optimizing biomass energy production.
Understanding Biomass Energy Monitoring
Key Monitoring Parameters
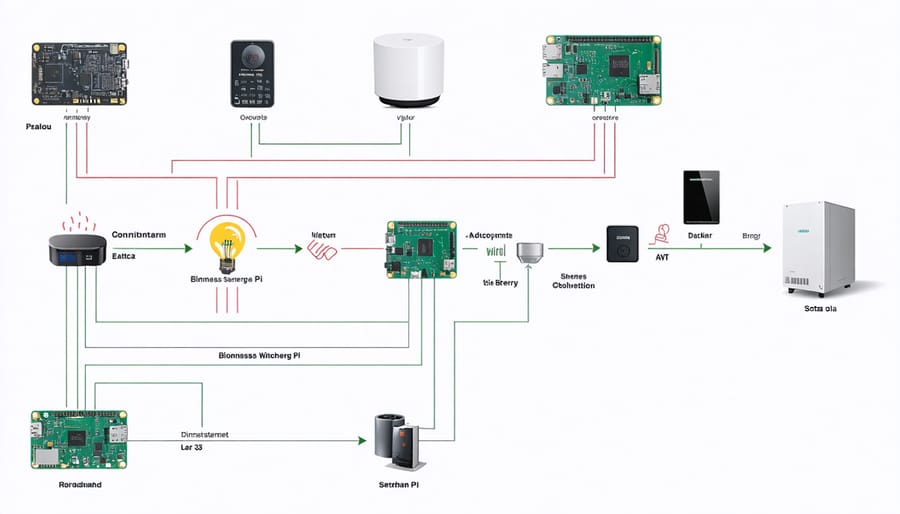
For effective biomass energy project monitoring, several key parameters must be tracked in real-time. Temperature sensors are essential at multiple points: the combustion chamber (typically 800-1000°C), heat exchanger, and exhaust system. Pressure measurements are crucial for monitoring the combustion process and ensuring optimal airflow, with typical operating pressures ranging from 1-2 bar in small-scale systems.
Fuel flow monitoring helps track biomass consumption rates and system efficiency. This can be achieved using load cells for solid biomass or flow meters for liquid biofuels. A typical small-scale system might consume 2-5 kg of biomass per hour, depending on the fuel type and energy demand.
Energy output measurements are vital for assessing system performance. Key metrics include electrical power output (measured in kW), thermal energy production (typically monitored through temperature differentials and flow rates), and overall system efficiency (usually 20-30% for electrical conversion and up to 85% for combined heat and power systems).
These parameters can be monitored using various sensors connected to a control system, with data logged at regular intervals for performance analysis and optimization.
Sensor Selection
For effective biomass monitoring with your Raspberry Pi, selecting the right sensors is crucial. The DHT22 temperature and humidity sensor serves as a primary component, offering accurate readings of environmental conditions with ±0.5°C temperature accuracy and ±2-5% humidity accuracy. This sensor connects easily to the Pi’s GPIO pins and provides reliable data for monitoring storage conditions.
The MQ-2 gas sensor is essential for safety monitoring, detecting smoke, methane, and other combustible gases that might indicate potential issues in your biomass storage. For weight monitoring, load cells with an HX711 amplifier can accurately measure biomass quantity and consumption rates.
A moisture content sensor, such as the capacitive soil moisture sensor, helps monitor biomass quality and optimal storage conditions. For more comprehensive monitoring, consider adding the BME280 sensor, which combines temperature, humidity, and atmospheric pressure measurements in a single unit.
All these sensors are readily available, cost-effective, and compatible with the Raspberry Pi’s GPIO interface. They can be easily integrated using Python libraries, making data collection and analysis straightforward for your biomass monitoring system.
Hardware Setup
Required Components
To build a functional biomass energy monitoring system with your Raspberry Pi, you’ll need several key components. The core of the system is a Raspberry Pi 4B (recommended for optimal power consumption optimization), along with a reliable power supply rated at 5V/3A. For temperature monitoring, you’ll require a DHT22 sensor and a K-type thermocouple with a MAX6675 module for accurate readings.
Essential components include:
– Raspberry Pi 4B (2GB RAM minimum)
– MicroSD card (16GB or larger)
– DHT22 temperature and humidity sensor
– MAX6675 thermocouple module
– K-type thermocouple probe
– Breadboard and jumper wires
– GPIO extension board
– LCD display (16×2 or 20×4)
– ADS1115 16-bit ADC converter
– Protective case for outdoor installation
Optional but recommended components include a cooling fan for the Raspberry Pi, a weather-resistant enclosure if installing outdoors, and a UPS HAT for backup power during outages. These components ensure reliable operation and accurate data collection for your biomass monitoring system.
Wiring and Connections
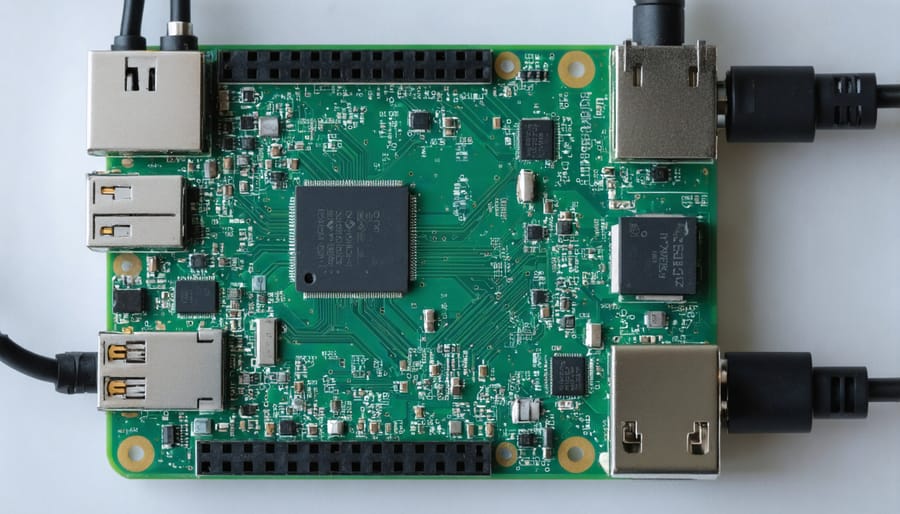
Begin by gathering all necessary components for the wiring setup. You’ll need your Raspberry Pi, the biomass sensor module, temperature sensors, and connecting wires. Ensure you have both male-to-male and male-to-female jumper wires on hand.
First, connect the biomass sensor’s VCC pin to the Raspberry Pi’s 5V power pin (physical pin 2). The sensor’s GND pin should be connected to any ground pin on the Pi (physical pin 6 recommended). Connect the sensor’s data output pin to GPIO17 (physical pin 11).
For temperature monitoring, attach the first DS18B20 temperature sensor’s VCC to the 3.3V power pin (physical pin 1). Connect its ground to any available GND pin, and the data pin to GPIO4 (physical pin 7). If using multiple temperature sensors, they can share the same power and ground connections, but each needs a separate GPIO pin.
Install a 4.7kΩ pull-up resistor between the temperature sensor’s VCC and data lines to ensure reliable readings. This is crucial for accurate temperature measurements.
For the control interface, connect the LCD display using the I2C protocol. Connect SDA to GPIO2 (physical pin 3) and SCL to GPIO3 (physical pin 5). The display’s VCC connects to 5V power, and GND to any ground pin.
Double-check all connections before powering up the system. Poor connections are a common source of issues in biomass projects. Use a multimeter to verify continuity if you’re unsure about any connections.
Secure all wires with cable ties or management clips to prevent disconnections during operation. This is especially important if your setup will be moved or installed in an area with vibration.
Software Implementation
Setting Up the Environment
Before diving into the biomass energy monitoring system, we need to set up our Raspberry Pi with the necessary software components. First, ensure your Raspberry Pi is running the latest version of Raspberry Pi OS and is connected to the internet.
Open the terminal and update your system:
“`bash
sudo apt update
sudo apt upgrade
“`
Install the required Python libraries for sensor communication and data processing:
“`bash
pip3 install RPi.GPIO
pip3 install adafruit-circuitpython-dht
pip3 install pandas
pip3 install matplotlib
“`
For the temperature and humidity sensors, you’ll also need to enable I2C communication:
“`bash
sudo raspi-config
“`
Navigate to “Interfacing Options” and enable I2C.
If you’re planning to use the web interface for monitoring, install the Flask framework:
“`bash
pip3 install flask
Finally, create a new project directory:
“`bash
mkdir biomass_project
cd biomass_project
“`
These installations provide all the necessary tools to build your biomass energy monitoring system. Double-check that all libraries installed correctly by running a quick Python import test for each component.
Data Collection Script
Here’s a Python script that collects data from our biomass monitoring sensors using the Raspberry Pi. The code reads temperature, humidity, and gas sensor values, then stores them in a CSV file for analysis:
“`python
import time
import board
import adafruit_dht
import RPi.GPIO as GPIO
import csv
from datetime import datetime
# Initialize sensors
dht_sensor = adafruit_dht.DHT22(board.D4)
MQ4_PIN = 17
GPIO.setmode(GPIO.BCM)
GPIO.setup(MQ4_PIN, GPIO.IN)
def read_sensors():
try:
temperature = dht_sensor.temperature
humidity = dht_sensor.humidity
gas_level = GPIO.input(MQ4_PIN)
return {
‘timestamp’: datetime.now(),
‘temperature’: temperature,
‘humidity’: humidity,
‘gas_level’: gas_level
}
except RuntimeError:
return None
def save_to_csv(data):
with open(‘biomass_data.csv’, ‘a’, newline=”) as file:
writer = csv.DictWriter(file, fieldnames=data.keys())
writer.writerow(data)
# Main loop
while True:
sensor_data = read_sensors()
if sensor_data:
save_to_csv(sensor_data)
print(f”Temperature: {sensor_data[‘temperature’]}°C”)
print(f”Humidity: {sensor_data[‘humidity’]}%”)
print(f”Gas Level: {sensor_data[‘gas_level’]}”)
time.sleep(300) # Read every 5 minutes
“`
This script uses the Adafruit DHT library for temperature and humidity readings, and GPIO pins for the gas sensor. Data is collected every 5 minutes and stored in a CSV file with timestamps for later analysis. Remember to install the required libraries using pip before running the script.
Data Visualization Dashboard
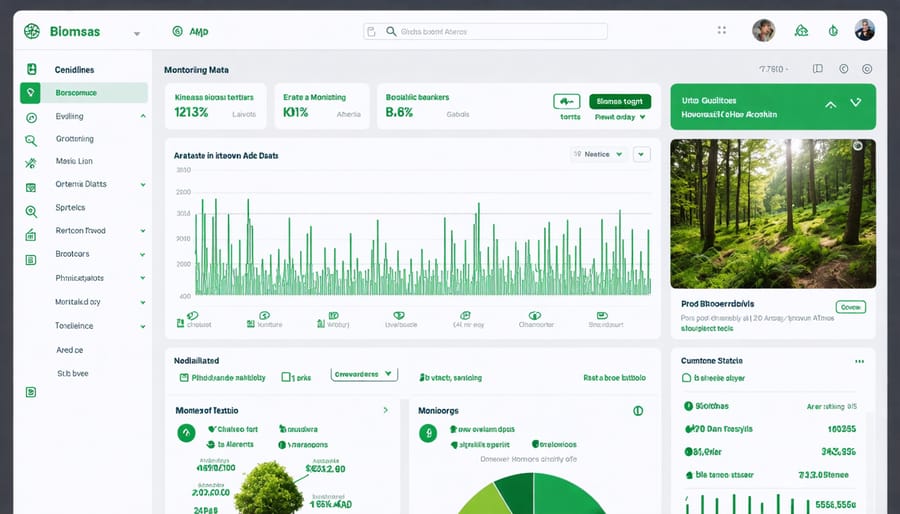
The heart of our biomass energy monitoring system lies in its user-friendly web dashboard, built using Flask and modern JavaScript libraries. This interface transforms raw sensor data into meaningful visualizations, similar to professional environmental monitoring systems, making it easy to track your biomass energy production in real-time.
The dashboard features multiple interactive charts displaying key metrics like temperature readings, moisture levels, and energy output. We’ve implemented Chart.js for smooth, responsive graphs that automatically update every 30 seconds. Users can toggle between different time ranges (hourly, daily, weekly) and export data in CSV format for further analysis.
The layout is divided into three main sections: Current Status, Historical Data, and System Health. The Current Status panel shows live readings with color-coded indicators for quick status assessment. Historical Data provides trend analysis through line graphs and heat maps, while System Health monitors equipment performance and alerts users to potential issues.
For mobile accessibility, we’ve employed a responsive design that automatically adjusts to different screen sizes. The interface includes customizable alerts that can be set up to notify users via email or SMS when readings fall outside predetermined ranges, ensuring constant system oversight even when you’re away from the monitoring station.
Real-time Monitoring and Alerts
Alert Configuration
To ensure you never miss critical events in your biomass energy monitoring system, we’ll set up automated alerts using both email and SMS notifications. First, install the required Python libraries by running ‘pip install smtplib twilio’ in your terminal. For email alerts, configure your Gmail account’s SMTP settings in the configuration file, making sure to use an app-specific password for enhanced security.
For SMS notifications, sign up for a free Twilio account and note down your account SID and auth token. Create a new Python script called ‘alerts.py’ and add the notification functions for both email and SMS. Set threshold values for temperature, moisture content, and energy output – when these values exceed your set limits, the system will automatically trigger alerts.
You can customize alert frequency and conditions using simple if-statements in your main monitoring script. For example, set up immediate alerts for critical conditions like excessive temperature, and daily digest emails for regular performance metrics. Remember to test your alert system thoroughly before deployment to ensure reliable notification delivery.
To avoid alert fatigue, implement a cool-down period between notifications and group similar alerts together when possible.
System Optimization
To maximize the performance of your biomass energy monitoring system, implementing proper system optimization techniques is crucial. Start by configuring your Raspberry Pi’s data sampling rate to match your specific needs – higher rates for detailed analysis or lower rates for long-term monitoring. Utilize database indexing and implement data compression techniques to manage storage efficiently while maintaining data integrity.
Consider implementing efficient power management strategies, especially for remote installations. This includes setting up sleep modes during low-activity periods and optimizing sensor polling intervals. Use caching mechanisms to reduce database load and implement a rolling data retention policy to prevent storage overflow.
For real-time monitoring, optimize your network configuration by using lightweight protocols like MQTT and implementing data buffering to handle connectivity interruptions. Regular system maintenance, including log rotation and automated cleanup scripts, will help maintain optimal performance. Consider using edge computing techniques to process data locally before transmission, reducing bandwidth usage and improving response times.
Remember to regularly backup your configuration and implement automated alert systems to notify you of any performance issues or anomalies.
The implementation of this biomass energy project demonstrates the versatility and potential of Raspberry Pi in sustainable energy monitoring and management. By successfully creating a system that tracks biomass consumption, monitors energy output, and manages the conversion process, we’ve shown how accessible technology can contribute to renewable energy solutions.
The project’s benefits extend beyond just monitoring capabilities. The real-time data collection and analysis provide valuable insights into energy efficiency, helping users optimize their biomass consumption and reduce waste. The web interface makes it easy for users to track their system’s performance from anywhere, while the automated alert system ensures timely maintenance and optimal operation.
Looking ahead, this project serves as a foundation for several potential expansions. Future iterations could incorporate machine learning algorithms to predict maintenance needs and optimize fuel consumption. Integration with other renewable energy sources, such as solar or wind power, could create a more comprehensive energy management system. Additionally, the project could be scaled up for larger industrial applications or adapted for community-based biomass energy initiatives.
For those interested in building upon this project, consider adding features like weather data integration, mobile app development, or expanding the sensor array for more detailed analytics. The open-source nature of both Raspberry Pi and this project’s code makes it an excellent starting point for further innovation in renewable energy monitoring and management.