
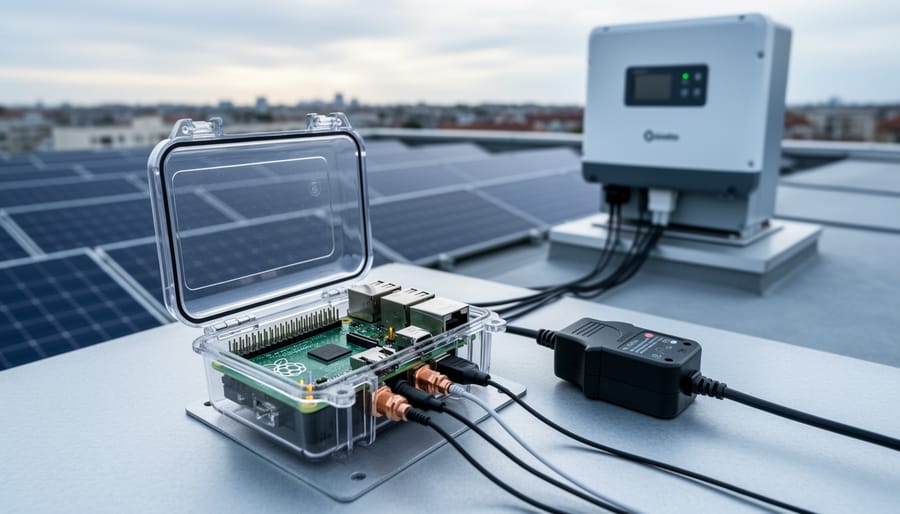
You can build a complete renewable energy monitoring system using a Raspberry Pi, basic current sensors, and open-source software in about four hours. This practical guide shows you how to track solar panel output, monitor battery charge levels, and log energy production data from your home renewable setup, whether you’re running rooftop solar, a small wind turbine, or a hybrid system.
The Raspberry Pi excels at this task because it runs continuously on minimal power (under 5 watts), provides GPIO pins for sensor connections, and supports Python libraries designed specifically for energy data collection. You’ll connect current transformers and voltage sensors to the Pi’s analog-to-digital converter, configure monitoring software to log real-time data, and set up a dashboard to visualize your system’s performance. The entire hardware cost typically runs between $75 and $120, depending on the sensors you choose and whether you already own a Pi.
This tutorial assumes you have intermediate Raspberry Pi experience and can follow circuit diagrams, but you don’t need electrical engineering expertise. We’ll walk through proper sensor selection for different system voltages, explain the critical safety precautions when working near live renewable energy equipment, and show you how to verify your readings against your inverter’s display before trusting the data.
Once your clean energy monitor is running, you’ll have minute-by-minute insight into how much energy your system generates, when production peaks occur, and whether your panels or turbines are performing as expected. The same setup can trigger alerts when production drops unexpectedly or automate smart home devices to run during peak generation hours, turning your monitoring project into the foundation of a smarter, more efficient renewable energy system.
Understanding U.S. Renewable Energy Systems and Monitoring Needs
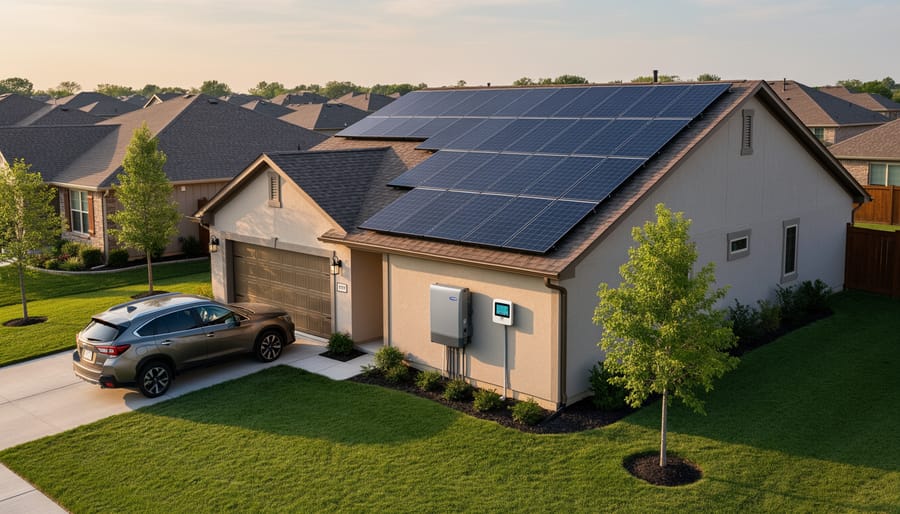
Most U.S. homeowners with renewable energy systems rely on three core components: solar panels (typically 5-10 kW for residential installations), a grid-tied inverter that converts DC to AC power, and increasingly, battery storage units like Tesla Powerwall or Enphase Encharge. The inverter handles the critical job of synchronizing your generated power with the utility grid, while batteries store excess production for evening use or outages. Grid-connected systems feed surplus electricity back to your utility under net metering agreements, where you earn credits at retail rates in many states, though policies vary significantly by location.
Real-time monitoring transforms these systems from passive generators into optimization tools. Real-time monitoring supports tracking of production anomalies, consumption patterns, and grid export volumes that directly affect your utility bill. Without monitoring, you might miss underperforming panels, battery degradation, or opportunities to shift heavy loads to peak solar hours. Net metering tracking matters especially in states with monthly rollover limits or seasonal reconciliation periods, where understanding your credit balance helps you maximize financial returns.
Raspberry Pi slots into this ecosystem as an affordable edge computing hub that costs under $100 versus $300-800 for proprietary monitoring systems. Commercial solutions often lock you into specific brands, charge subscription fees for cloud dashboards, or provide limited API access for custom automation. A Pi running Python scripts can poll inverter APIs, read current sensors directly, log data to local databases, and trigger smart plugs or HVAC systems based on solar availability. You own the data, control the integrations, and expand functionality as your needs grow without vendor limitations.
Tools and Hardware You’ll Need
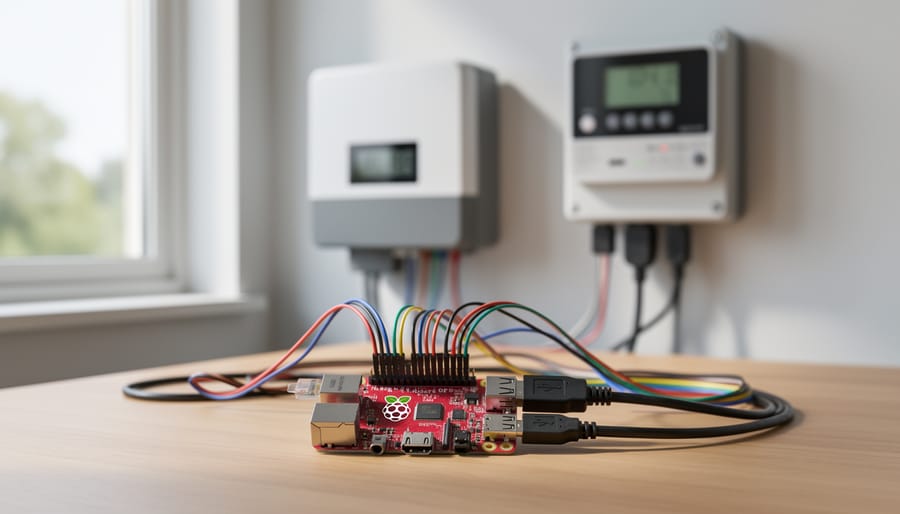
Building a renewable energy monitoring system with your Raspberry Pi requires a combination of hardware components and software tools. Here’s everything you’ll need to get started, from the Pi itself to the sensors that will track your energy production and consumption.
Core Hardware Components
- Raspberry Pi 4 (4GB RAM) or Raspberry Pi 5, both models provide ample processing power for real-time data collection and analysis
- Official Raspberry Pi power supply (15W USB-C for Pi 4, 27W USB-C for Pi 5), reliable power prevents data corruption and system crashes
- MicroSD card (32GB minimum, Class 10 or UHS-1), stores your operating system and months of energy data
- INA219 current/voltage sensor modules (2-4 units), monitor DC circuits between solar panels and batteries with I2C connectivity
- SCT-013 split-core current transformers (CT clamps, 30A-100A rated), non-invasive monitoring of AC circuits for household consumption and grid export
- Ethernet cable or WiFi dongle, stable network connection for data transmission and remote access
- Protective case with ventilation, shields components from dust while preventing overheating
For integration with commercial systems, you’ll need API credentials from your existing equipment. SolarEdge and Enphase inverters offer monitoring APIs that work alongside your Pi-based sensors. If you have an Emporia Vue energy monitor already installed, the Pi can pull data from it rather than requiring separate CT clamps on every circuit.
Software Requirements
On the software side, start with Raspberry Pi OS Lite (64-bit recommended for Pi 4 and 5). You’ll install Python 3.9 or newer along with essential libraries: Adafruit_CircuitPython for sensor communication, paho-mqtt for data messaging, and influxdb-client for database storage. The MQTT broker Mosquitto handles real-time data streams between components.
For visualization and automation, choose between Grafana (powerful dashboards with extensive customization) or Home Assistant (integrates monitoring with smart home controls). Both run smoothly on a Raspberry Pi 4 or 5, though you might dedicate a separate Pi if you’re running multiple services.
Optional accessories include a small touchscreen display for local monitoring without network access, a USB battery backup to prevent shutdown during brief outages, and a weatherproof enclosure if mounting near outdoor equipment.
Safety Warnings and Precautions
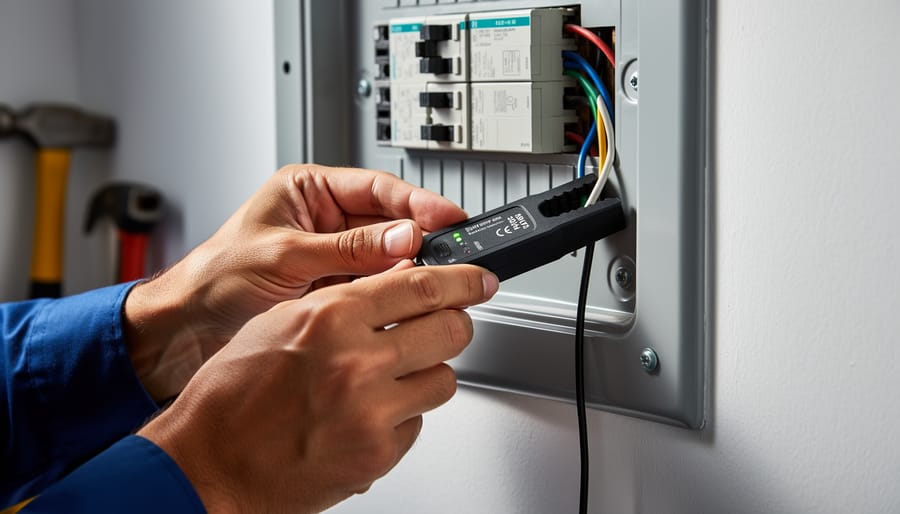
Before you connect a single sensor to your renewable energy system, you need to understand a fundamental distinction: Raspberry Pi monitoring operates at safe low voltages (3.3V to 5V DC), while solar panels, inverters, and household circuits carry dangerous high-voltage AC power that can cause serious injury or death. This project focuses exclusively on non-invasive monitoring techniques that keep you safely away from live electrical circuits.
Never open inverter enclosures, touch bare wiring, or work on any circuit while it’s energized. The monitoring approach outlined in this guide uses current transformers (CT clamps) that clip around insulated wires without making direct electrical contact, measuring current through magnetic induction rather than by interrupting the circuit. This non-invasive method means you’re not breaking into any high-voltage systems or creating potential failure points in your solar installation.
Understand your system’s voltage boundaries. Your solar panels might generate 300-400V DC before the inverter, and the AC side connects to your 120V or 240V household circuits. The Raspberry Pi sensors you’ll install operate independently at safe voltages, reading data from CT clamps or communicating digitally with inverters via APIs, never tapping directly into high-voltage lines.
Know when to call a professional. If your monitoring requires opening electrical panels, relocating circuits, installing hardware inside inverter enclosures, or any work that involves exposed conductors, hire a licensed electrician familiar with solar installations. Some jurisdictions require permitted work for any panel modifications, even for monitoring equipment. Your project should supplement existing systems, not modify them.
Proper grounding matters for data accuracy and safety. While your low-voltage sensors don’t carry dangerous current, electrical noise from inverters can corrupt readings without clean ground references. Connect your Raspberry Pi’s ground to a proper earth ground (never to a water pipe or gas line), and ensure CT clamps are installed on circuits with intact insulation and proper grounding already in place.
This monitoring approach respects both solar sustainability principles and electrical safety codes. You’ll gain valuable energy insights without compromising your system’s integrity or your personal safety, learning the fundamentals before considering any advanced integration that might require professional installation.
Step-by-Step Setup Process
Preparing Your Raspberry Pi
Start with a fresh Raspberry Pi 4 or 5 and a 32GB microSD card. Download Raspberry Pi OS Lite from the official Raspberry Pi website using the Raspberry Pi Imager tool. Before writing the image, configure your hostname, enable SSH with password authentication, and set up your WiFi credentials through the Imager’s advanced options. Flash the OS to the card, insert it into your Pi, and power up.
Once the Pi boots, SSH into it from your computer using the credentials you configured. Your first tasks are system preparation and installing the software stack for energy monitoring:
- Update all existing packages by running sudo apt update && sudo apt upgrade -y to ensure system security and compatibility.
- Enable the I2C and SPI interfaces needed for sensor communication through sudo raspi-config, navigating to Interface Options and enabling both protocols.
- Install Python 3 and pip if not already present with sudo apt install python3-pip python3-dev -y.
- Install the Adafruit CircuitPython libraries for sensor communication using pip3 install adafruit-circuitpython-ina219.
- Add MQTT support for messaging between components with pip3 install paho-mqtt.
- Install the InfluxDB Python client for time-series data logging through pip3 install influxdb-client.
- Reboot the Pi with sudo reboot to activate interface changes.
After the reboot, verify I2C is working by running sudo i2cdetect -y 1, which should display a grid without errors. Create a project directory at /home/pi/energy-monitor to organize your monitoring scripts. Your Pi is now ready for sensor connections and data collection code.
Connecting Energy Sensors
With your Raspberry Pi ready, you can wire the sensors that measure current and voltage from your renewable energy system. Start with the INA219 module, which monitors DC voltage and current with reasonable accuracy. Connect the module’s VCC pin to the Pi’s 3.3V pin (physical pin 1), GND to ground (pin 6), SDA to GPIO 2 (pin 3), and SCL to GPIO 3 (pin 5). If you’re monitoring multiple circuits, you can connect up to four INA219 modules to the same I2C bus by changing each module’s address using the onboard solder jumpers.
For the actual power measurements, wire your solar panel’s positive output through the INA219’s VIN+ and VIN- terminals. If your system runs at 12V or 24V DC, the INA219 handles this directly. Never connect the module to AC voltage or high-voltage DC circuits above 26V without appropriate step-down circuitry, as you’ll damage both the sensor and potentially your Pi.
CT clamps offer a safer, non-invasive option for monitoring AC circuits. Clip the CT clamp around a single wire (hot or neutral, never both) carrying current from your inverter. Connect the clamp’s output leads to an analog-to-digital converter like the ADS1115, then wire that ADC to your Pi’s I2C pins using the same connection pattern as the INA219.
Test your setup with a basic Python script. Install the Adafruit CircuitPython libraries, then run a simple loop that reads voltage and current every few seconds and prints the values. Compare these readings against a multimeter measurement to confirm accuracy within 5 percent. If readings seem wildly off, check your wiring polarity and verify the I2C address matches your Python code using the `i2cdetect` command.
Integrating with Existing Energy Systems
Most residential solar systems in the U.S. already collect production data through the manufacturer’s inverter. Your Raspberry Pi monitoring setup becomes far more powerful when you pull this existing data rather than duplicating measurements.
SolarEdge, Enphase, and Tesla Powerwall all offer API access, though setup varies. SolarEdge provides a cloud API with developer keys that require registration and typically grant 15-minute data granularity. Enphase Enlighten uses JWT authentication and can deliver real-time production per panel through their Envoy gateway. Tesla Powerwall offers a local API if you’re on the same network, giving second-by-second battery state-of-charge and grid import/export without cloud dependencies.
Local polling beats cloud APIs for speed and reliability. If your inverter has an ethernet port or WiFi connection, query it directly, most SolarEdge inverters speak Modbus TCP over the local network, letting your Pi scrape data every few seconds without internet latency. Cloud APIs introduce delays, rate limits (often 300 requests per day), and dependency on the manufacturer’s servers staying online.
Combining manufacturer data with your direct CT clamp measurements creates a cross-check system. The inverter tells you what the panels produce; your sensors measure what actually enters the house and what the grid sees. Discrepancies highlight conversion losses, wiring issues, or consumption you hadn’t accounted for. Write a Python script that polls both sources every 10 seconds, compares values, and logs them to InfluxDB together. This dual-source approach catches problems commercial monitoring misses and gives you confidence in your whole-system picture.
Setting Up Data Logging and Visualization
InfluxDB serves as the backbone for storing your renewable energy data because it’s optimized for time-series information, perfect for tracking solar production, consumption patterns, and battery metrics every few seconds. Install it on your Raspberry Pi with `sudo apt install influxdb influxdb-client`, then create a database for your energy data using the InfluxDB CLI. Configure your Python monitoring scripts to write sensor readings directly to this database using the InfluxDB Python library, structuring data points with tags for source (solar, grid, battery) and fields for actual measurements (watts, voltage, current).
Once data flows into InfluxDB, Grafana transforms those numbers into actionable real-time dashboards. Install Grafana with `sudo apt install grafana`, connect it to your InfluxDB instance, and start building panels. Your essential dashboard should track:
- Current solar production in watts with 5-second refresh
- Daily and monthly generation totals in kWh
- Grid import versus export to track net metering credits
- Battery state of charge percentage if you have storage
- Real-time cost calculations based on your utility rates
For Home Assistant integration, add InfluxDB as a data source and create automations that trigger based on your energy thresholds. You can automatically start your electric water heater when solar production exceeds 2kW, or send notifications when battery charge drops below 20%. Set up Grafana alerts for system anomalies, no production during daylight hours indicates a potential inverter failure, while unexpectedly high consumption might signal a malfunctioning appliance. Configure alert channels to send notifications via email or Telegram so you catch issues before they cost money.
Verification and Testing Your System
After your monitoring system is running, validation is crucial to ensure you’re getting accurate data. Start by cross-referencing your Raspberry Pi sensor readings against your inverter’s built-in display for at least an hour during peak production. Most modern inverters show real-time wattage and cumulative kWh generation, your Pi readings should match within 5-10%, accounting for slight measurement lag and sensor positioning. Next, compare daily production totals against your utility meter’s net export data (if your state offers net metering) over a 48-hour period to confirm no systematic drift.
Calculate expected solar production using online tools like PVGIS or PVWatts, which factor in your location’s solar irradiance, panel tilt, and shading. If your actual production consistently underperforms by more than 15% versus the estimate, check sensor installation (CT clamps must face the right direction) or investigate panel issues. Test data logging continuity by reviewing your InfluxDB or CSV logs for gaps, set up automated alerts if no data arrives for 10 minutes, which catches network drops early. Common troubleshooting: sensor drift often stems from loose wire connections or temperature fluctuations affecting analog readings, while network connectivity issues usually trace to WiFi signal strength or DHCP lease problems. For more complex smart home projects integrating multiple sensors, run a 72-hour burn-in test to expose intermittent failures before considering the system production-ready.
Optimizing Performance and Next Steps
Once your monitoring system reliably captures production and consumption data, you can shift from passive observation to active optimization. The real payoff comes when you use Raspberry Pi to automate energy decisions in real time, squeeze more value from net metering programs, and predict production patterns before they happen.
Start with automated load shifting, which means running power-hungry appliances when your panels generate surplus electricity. Write Python scripts that check your current solar production against household consumption, then trigger smart plugs or relays when excess capacity exists. For example, delay your water heater or pool pump until midday solar peaks rather than running them on evening grid power. This becomes especially valuable in states where net metering varies by state and export credits may be lower than retail rates. If your excess solar earns 4 cents per kilowatt-hour as a credit but you pay 12 cents when buying from the grid, every load you shift saves 8 cents.
Integrate Home Assistant or similar platforms to coordinate multiple devices. Your Pi can send MQTT messages to smart thermostats, dryers, dishwashers, and EV chargers, creating a choreographed response to solar availability. Set temperature pre-cooling during peak production so your air conditioner coasts through expensive evening hours on stored coolness rather than grid power.
Weather API integration adds forecasting capability. Pull solar irradiance predictions from services like OpenWeatherMap or NOAA, then estimate tomorrow’s production. If heavy clouds are forecast, your system can pre-charge batteries or run critical loads early rather than gambling on afternoon sunshine.
Consider these optimization strategies for your next development phase:
- Track monthly net metering credits by logging export totals and comparing against utility bills to verify accurate compensation
- Create production heatmaps showing which hours and seasons generate peak output, guiding future equipment purchases or panel cleaning schedules
- Set up performance alerts that notify you when production drops below expected levels for current weather conditions, catching panel shading or inverter faults early
- Build cost-avoidance dashboards that calculate dollars saved by solar versus grid-only scenarios, motivating continued system optimization
- Configure remote monitoring through WireGuard VPN or Cloudflare Tunnel so you can check system health from anywhere without exposing ports directly to the internet
For remote access, avoid simple port forwarding. Install WireGuard on your Pi to create an encrypted tunnel, or use Cloudflare’s free tunneling service to access Grafana dashboards securely. This lets you monitor performance during vacations and respond to alerts without risking your home network.
The beauty of Pi-based monitoring is incremental expansion. Add one automation, test it for a week, then layer on the next feature. Each improvement compounds the value of your renewable investment while deepening your understanding of home energy flows.
Frequently Asked Questions
Building a Raspberry Pi renewable energy monitoring system raises practical questions about compatibility, costs, and capabilities. Here are answers to the most common concerns.
Can this work with wind turbines?
Yes, the same current and voltage sensors work with wind turbines. You’ll monitor the AC output from the turbine’s inverter the same way you would solar production, though wind data tends to be more variable and requires longer averaging periods for useful analysis.
Does this void my inverter warranty?
No, monitoring-only installations that don’t modify or interfere with inverter circuits won’t affect your warranty. You’re simply reading data, not altering the equipment. Many manufacturers actually encourage monitoring through their own APIs.
How accurate is Pi-based monitoring compared to commercial solutions?
With quality sensors like the INA219, you can achieve 1-2% accuracy, comparable to mid-range commercial monitors. The main difference is commercial systems often include calibration certificates and professional installation, but for home optimization decisions, Pi accuracy is more than sufficient.
What’s the typical cost for a complete setup?
Expect to spend around 150-250 dollars total. A Raspberry Pi 4 or 5 runs about 75 dollars, current sensors cost 30-60 dollars depending on quantity and type, and you’ll need a microSD card, case, and power supply for another 40-50 dollars. This is far cheaper than dedicated monitoring systems that start at 500 dollars.
Remote monitoring across multiple locations is completely feasible with the right network configuration. You can set up each Raspberry Pi to push data to a central InfluxDB instance running on a cloud server or a Pi at your primary location. Home Assistant supports multiple site integration natively, letting you view production and consumption from vacation properties, rental units, or family members’ homes in a single dashboard. The key is securing remote access properly through VPN connections or SSH tunnels rather than exposing your Pi directly to the internet.
Data retention becomes important when monitoring multiple sites. A typical single-location setup generates about 50-100 MB of data monthly with one-minute sampling intervals. If you’re aggregating data from three or four properties, plan for adequate storage on your central database server and consider automated data pruning policies that keep high-resolution recent data but downsample older records to daily or hourly averages. This keeps your system responsive while preserving long-term trends for seasonal comparisons and return-on-investment calculations.
Building a Raspberry Pi-based renewable energy monitoring system gives you real control over your home’s energy future. You’ll gain deep insights into production patterns, consumption habits, and cost savings that commercial monitoring solutions often hide behind subscription fees or proprietary dashboards. The hardware investment typically runs $75-150 for a basic setup, but you’re not just buying components, you’re learning how renewable systems actually work, from voltage curves to grid synchronization.
Start simple. Get your Pi reading a single solar circuit, verify the data against your inverter, and build confidence in the system. Once you see accurate numbers flowing into your first Grafana dashboard, you’ll naturally spot opportunities: running the dishwasher during peak production, catching inverter glitches before they cost money, or understanding exactly how shade affects your panels. These practical wins matter more than elaborate automation on day one.
The beauty of this approach is expandability. Add sensors as your curiosity grows. Integrate weather forecasting when you’re ready. Connect smart plugs to shift loads automatically. Every upgrade teaches you something new about both Raspberry Pi and renewable energy, skills that compound over time. Your monitoring system evolves with you, and unlike proprietary solutions, you own every line of code and every data point it generates.