
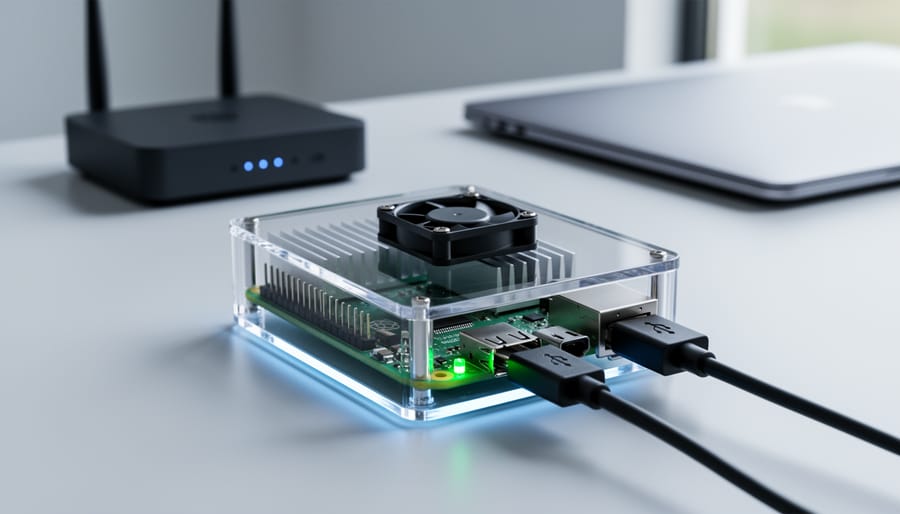
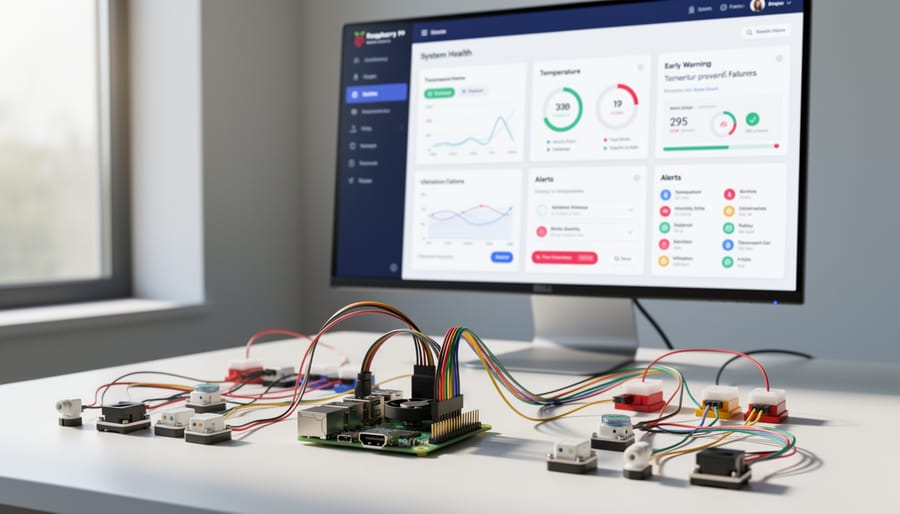
Monitor your Raspberry Pi’s CPU temperature, memory usage, and disk space in real-time using dedicated software like Netdata or Prometheus to prevent thermal throttling and system crashes before they happen. Install a lightweight dashboard solution such as Glances or RPi-Monitor within minutes through simple command-line instructions, giving you instant visibility into performance metrics without consuming precious system resources.
Check your Pi’s uptime statistics and network traffic patterns through web-based interfaces accessible from any device on your network, eliminating the need to connect a monitor or SSH into your device repeatedly. Set up automated alerts that notify you via email or mobile push notifications when critical thresholds are breached—whether it’s excessive CPU load during a home automation task or storage running low on your media server.
Compare resource-efficient options like Cockpit for beginners seeking plug-and-play simplicity against advanced monitoring stacks like Grafana combined with InfluxDB for users running multiple Pi devices who need historical data analysis and custom visualizations. Deploy container-based monitoring solutions using Docker to isolate your monitoring tools from project workloads, ensuring that tracking your system’s health doesn’t interfere with your primary applications.
Track security metrics including failed login attempts, open ports, and unusual process activity to identify potential vulnerabilities in projects exposed to the internet. Configure monitoring software to log performance data over weeks or months, helping you identify patterns like memory leaks in custom scripts or seasonal temperature fluctuations affecting your hardware’s reliability.
Why Your Raspberry Pi Needs Remote Monitoring
Your Raspberry Pi might be humming away in a closet, under your desk, or tucked into a server rack, but without proper monitoring, you’re essentially flying blind. Whether you’re running a game server, hosting a personal website, or managing a network of IoT sensors, monitoring software acts as your early warning system and performance guardian.
Consider this common scenario: your home server has been working perfectly for weeks until suddenly friends can’t access your shared media library. Without monitoring, you’re left guessing whether it’s a network issue, overheating, storage failure, or something else entirely. With proper monitoring in place, you would have received alerts about rising temperatures or disk space running low days before the crash occurred.
Preventing downtime is just the beginning. Monitoring helps you catch resource bottlenecks before they impact performance. That retro gaming emulator running smoothly today might start lagging tomorrow if CPU usage creeps up due to background processes. Real-time monitoring lets you spot these trends and optimize accordingly, ensuring your projects run efficiently without wasting precious resources.
Security represents another critical concern. Remote monitoring allows you to track unusual login attempts, unexpected network traffic, or suspicious CPU spikes that might indicate unauthorized access or cryptocurrency mining malware. For educational deployments where multiple students access Raspberry Pi devices, monitoring provides accountability and helps identify when devices need attention.
The beauty of monitoring software lies in its proactive nature. Instead of discovering problems when something breaks, you gain visibility into system health metrics like temperature, memory usage, network performance, and storage capacity. This insight transforms your approach from reactive troubleshooting to preventive maintenance, saving countless hours of frustration and keeping your projects running smoothly. For anyone serious about their Raspberry Pi deployments, monitoring isn’t optional anymore, it’s essential infrastructure that pays dividends in reliability and peace of mind.
What to Monitor on Your Raspberry Pi
System Resources and Performance
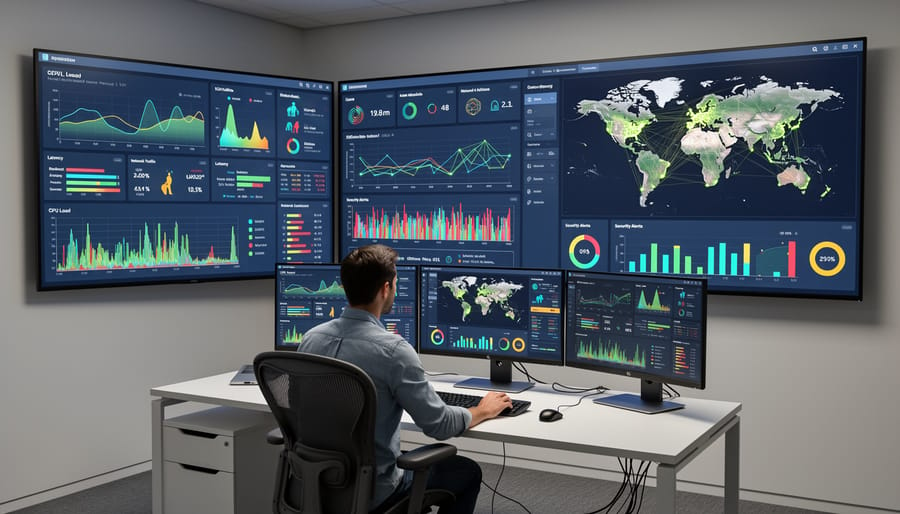
Understanding your Raspberry Pi’s system resources helps you maintain optimal performance and prevent issues before they occur. CPU usage tells you how hard your processor is working—consistently high percentages might indicate a program consuming too many resources or background processes needing attention. RAM utilization shows how much memory your active programs are consuming; when this approaches 100%, your Pi slows down as it starts using slower swap memory instead.
Disk space monitoring is equally important—running out of storage can cause crashes and data loss. Most monitoring tools display available space as percentages, making it easy to spot when you’re approaching capacity. Temperature monitoring deserves special attention since overheating can throttle performance or damage your Pi. The typical safe operating range is below 80°C, though your device may throttle at 82°C. Tools like lm-sensors for temperature monitoring provide real-time thermal data to ensure your cooling solution is adequate. By tracking these four metrics together, you’ll quickly identify bottlenecks, plan upgrades, and keep your projects running smoothly.
Network Activity and Connectivity
Keeping tabs on your Raspberry Pi’s network activity is essential for understanding how your device communicates with the outside world. Network monitoring helps you track bandwidth usage, identify connected devices, and spot suspicious activity that might indicate security issues.
Tools like vnStat provide lightweight bandwidth monitoring, recording data transfer over time without consuming excessive resources. For real-time insights, iftop displays current connections and their bandwidth consumption in a simple terminal interface. If you prefer visual representations, you can build a network monitoring dashboard using tools like Grafana combined with collectd or Telegraf.
Connection status monitoring is equally important. Software like Nagios or Zabbix can alert you when your Pi loses internet connectivity or when specific services become unreachable. These tools prove invaluable for remote deployments where physical access is limited.
For detecting unusual patterns, consider implementing Suricata or Snort for intrusion detection. These applications analyze network packets and flag potentially malicious activity, helping you maintain security without requiring constant manual oversight. Start with simpler tools like vnStat before progressing to comprehensive solutions as your monitoring needs grow.
Security and Access Logs
Keeping tabs on who’s accessing your Raspberry Pi is essential for maintaining security and troubleshooting issues. Security and access logs track every login attempt, failed authentication, and potential security threat, giving you a clear picture of your device’s exposure.
Start by monitoring /var/log/auth.log, which records all authentication attempts. Use simple commands like “sudo tail -f /var/log/auth.log” to watch real-time login activity, or “sudo grep ‘Failed password’ /var/log/auth.log” to spot suspicious access attempts. Tools like Fail2Ban automatically block IP addresses after repeated failed logins, adding an extra security layer.
For comprehensive tracking, consider implementing security monitoring solutions that centralize log management. Logwatch sends daily email summaries of system activity, while more advanced options like Elasticsearch and Kibana provide visual dashboards for analyzing patterns across multiple devices.
Set up automated alerts for critical events like root access attempts or unusual login times. Regular log reviews help identify compromised credentials before damage occurs. Remember to rotate logs periodically to prevent storage issues, using logrotate to automate this process and maintain historical records without overwhelming your SD card.
Top Raspberry Pi Monitoring Software Solutions
Prometheus with Grafana
For serious Raspberry Pi projects requiring enterprise-level monitoring capabilities, the Prometheus and Grafana combination stands out as the gold standard. This powerful open-source duo is particularly popular among developers running multiple Pi devices or complex applications that demand detailed performance insights.
Prometheus serves as the data collection engine, scraping metrics from your Raspberry Pi at regular intervals and storing them in a time-series database. Grafana then transforms this raw data into stunning, customizable dashboards with real-time graphs, alerts, and visualizations. Together, they provide professional-grade monitoring that rivals commercial solutions.
Installation requires some Linux familiarity but is well-documented. You’ll typically install Prometheus first to begin collecting metrics like CPU usage, memory consumption, disk I/O, and network traffic. The Node Exporter component gathers system-level statistics from your Pi. Next, you’ll set up Grafana and configure it to pull data from Prometheus, creating dashboards tailored to your specific needs.
What makes this combination exceptional is its flexibility and scalability. You can monitor a single Pi or an entire cluster, create custom alerts for specific conditions, and even track application-specific metrics beyond basic system statistics. The Grafana community offers thousands of pre-built dashboard templates, allowing you to get started quickly while learning the platform.
While the initial setup requires more effort than simpler alternatives, the investment pays off with unmatched visualization capabilities and detailed historical data analysis. This solution is ideal for production environments, home labs running critical services, or anyone wanting professional monitoring tools without licensing costs.
Netdata
Netdata stands out as one of the most beginner-friendly monitoring solutions available for Raspberry Pi. Within minutes of installation, you’ll have access to stunning, real-time dashboards displaying everything from CPU usage and memory consumption to temperature readings and network activity. What makes Netdata particularly impressive is its zero-configuration approach—it automatically detects and monitors hundreds of metrics without requiring you to edit complex configuration files.
The web interface updates every second, giving you a live view of your Pi’s performance that’s both informative and visually appealing. Interactive charts let you zoom into specific time periods, making troubleshooting straightforward even if you’re new to system monitoring. Netdata also includes built-in alarms that notify you when metrics exceed safe thresholds, helping prevent issues before they become serious problems.
The software runs efficiently on Raspberry Pi’s limited resources, using approximately 1-3% CPU during normal operation. While it does consume around 100-200MB of RAM, the trade-off is worthwhile for the comprehensive monitoring capabilities you receive. Installation is refreshingly simple—just run a single command, and you’re ready to start monitoring. For users who want professional-grade monitoring without the steep learning curve, Netdata delivers immediate results that make system management accessible and even enjoyable.
RPi-Monitor
RPi-Monitor is a lightweight, purpose-built monitoring solution that feels right at home on your Raspberry Pi. What makes it special is its minimal resource footprint—it won’t bog down your Pi’s limited processing power while keeping tabs on system performance. The setup process is refreshingly straightforward, requiring just a few terminal commands to get up and running. Once installed, you’ll access a clean web interface that displays real-time stats including CPU temperature, memory usage, network activity, and disk space.
This tool shines in scenarios where simplicity and efficiency matter most. It’s perfect for beginners dipping their toes into Pi monitoring, as the interface presents information clearly without overwhelming you with options. Hobbyists running home servers, retro gaming stations, or media centers will appreciate how RPi-Monitor provides just enough insight without complexity. The software stores historical data, letting you track trends over time—handy for spotting patterns like temperature spikes during heavy workloads. While it lacks the advanced alerting features of enterprise solutions, RPi-Monitor delivers exactly what most Pi enthusiasts need: a no-fuss way to ensure their projects stay healthy and performing optimally.
Nagios
Nagios stands as the heavyweight champion of monitoring software, originally designed for enterprise data centers but fully capable of managing your Raspberry Pi fleet. If you’re running multiple Pi devices in a homelab or educational environment, Nagios offers comprehensive monitoring that tracks everything from CPU temperature to network latency across all your devices simultaneously.
The learning curve is undeniably steep. Unlike plug-and-play solutions, Nagios requires configuration file editing and understanding of monitoring principles. You’ll spend time setting up hosts, services, and notification rules. However, this complexity brings incredible flexibility—you can monitor virtually anything through custom plugins and scripts.
Is Nagios worth the investment of time? If you’re managing 5+ Raspberry Pis or need professional-grade alerting with detailed historical data, absolutely. It’s particularly valuable for classroom environments where educators need centralized visibility into student projects, or for homelab enthusiasts building complex infrastructure.
The free Nagios Core version provides robust functionality, though the interface feels dated compared to modern alternatives. For beginners or single-device monitoring, simpler options will serve you better. But if you’re serious about infrastructure monitoring and want enterprise capabilities without enterprise costs, Nagios delivers unmatched power and reliability once you’ve conquered its initial complexity.
Cloud-Based Solutions (DataDog, New Relic)
Professional cloud monitoring platforms like DataDog and New Relic might seem like overkill for Raspberry Pi projects, but their generous free tiers make them surprisingly accessible for hobbyists. DataDog offers free monitoring for up to 5 hosts, while New Relic provides 100GB of free data ingestion monthly—more than enough for most single-board computer setups.
These services excel when you need enterprise-grade features like advanced alerting, historical data analysis beyond a few days, or sophisticated dashboards that correlate metrics from multiple sources. For example, if you’re running a home automation system with several Raspberry Pis, cloud monitoring centralizes everything in one interface accessible from anywhere.
Setup typically involves installing a lightweight agent on your Pi that reports metrics to the cloud platform. Both services provide detailed CPU, memory, disk, and network statistics, plus custom metrics if you’re running specific applications.
Cloud-based monitoring makes particular sense when you need reliable external monitoring—if your Pi goes completely offline, local monitoring tools can’t alert you, but cloud services will immediately notify you via email or SMS. The tradeoff is ongoing internet dependency and potential privacy considerations, since your system data lives on external servers. For classroom environments or collaborative projects where multiple people need monitoring access, cloud solutions often provide the easiest permission management.
Step-by-Step: Setting Up Your First Monitoring System
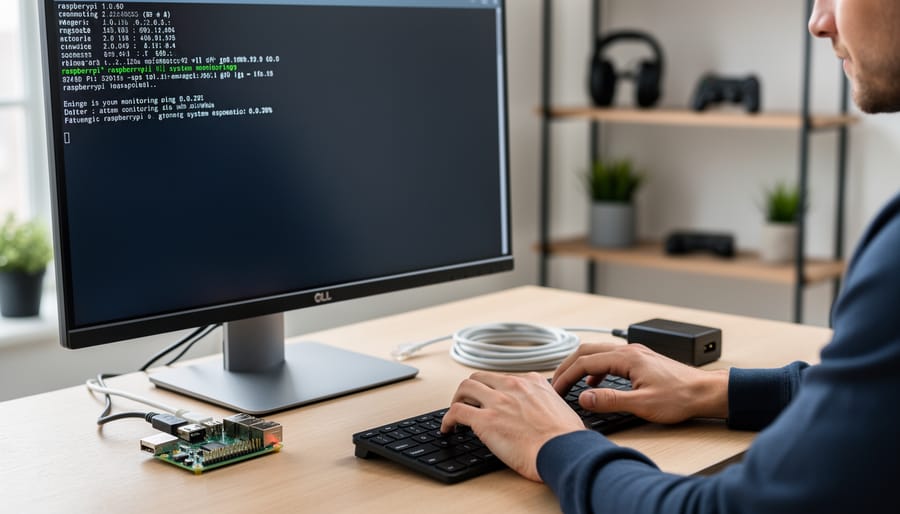
Installation Process
Before diving into installation, ensure your Raspberry Pi meets these basic requirements: Raspberry Pi OS (Buster or newer), at least 512MB free RAM, and a stable internet connection. Most monitoring software installs in 5-10 minutes.
Let’s walk through installing Netdata, a popular real-time monitoring solution. First, update your system packages to ensure compatibility:
sudo apt update && sudo apt upgrade -y
This command refreshes your package list and upgrades existing software. Next, install Netdata using their official one-line installer:
bash <(curl -Ss https://my-netdata.io/kickstart.sh)
This script automatically detects your system configuration and installs all necessary dependencies. The installer will download required packages and configure Netdata to start automatically on boot. During installation, you'll see progress messages indicating which components are being set up.
Once complete, verify the installation by accessing the web interface at http://your-pi-ip-address:19999 from any browser on your network. You should immediately see real-time graphs displaying CPU usage, memory consumption, network activity, and disk performance.
The entire process typically takes 8-12 minutes depending on your internet speed and Pi model. If you encounter permission errors, ensure you're running commands with sudo privileges.
Accessing Your Dashboard Remotely
Accessing your Raspberry Pi monitoring dashboard from anywhere opens up powerful possibilities for remote management. The most straightforward approach is setting up port forwarding on your router, which directs external traffic to your Pi's local IP address. Log into your router's admin panel, locate the port forwarding section, and create a rule that forwards an external port (like 8080) to your Pi's internal IP on the monitoring software's port. However, exposing your Pi directly to the internet carries security risks.
For enhanced security, SSH tunneling provides an encrypted pathway to your dashboard. First, enable SSH on your Pi and ensure you're using key-based authentication rather than passwords. Then, create an SSH tunnel from your remote computer using the command: ssh -L 8080:localhost:3000 pi@your-pi-ip. This forwards your local port 8080 to the Pi's monitoring port through an encrypted connection. You can then access the dashboard at localhost:8080 in your browser.
For a more user-friendly experience, consider our comprehensive remote desktop setup guide. Alternatively, services like Tailscale or Zerotier create secure virtual networks without complex port forwarding, making remote access both simple and secure for beginners.
Configuring Alerts and Notifications
Proper alert configuration prevents both missed critical events and notification overload. Start by identifying truly important metrics for your project—typically CPU temperature above 80°C, available disk space below 10%, or service failures. Most monitoring tools like Prometheus and Grafana allow you to set custom thresholds through their web interfaces.
For email notifications, configure your monitoring software's SMTP settings with your email provider's details. Gmail and Outlook work well for home projects. Mobile alerts often require third-party services like Pushover or Telegram bots, which integrate easily with most monitoring platforms through webhooks or API calls.
To avoid alert fatigue, implement escalation policies. Set warning thresholds before critical ones—for example, alert at 70% disk usage with a warning, then again at 90% as critical. Use rate limiting to prevent duplicate notifications during ongoing issues. Group related alerts together rather than receiving individual messages for every metric spike.
Test your alerts regularly by temporarily adjusting thresholds or simulating load conditions. This ensures notifications reach you reliably when genuine problems occur, keeping your Raspberry Pi projects running smoothly without constant interruptions.

Making the Right Choice for Your Project
Choosing the right monitoring solution comes down to three key factors: your technical comfort level, what you need to monitor, and how much time you want to invest in setup and maintenance.
If you're just starting out with Raspberry Pi projects, web-based dashboards like Netdata or Glances offer the gentlest learning curve. These tools provide instant visualization without requiring command-line expertise. You'll get up and running in under 30 minutes, making them perfect for monitoring home servers, media centers, or simple IoT projects.
For intermediate users comfortable with configuration files and command-line tools, Prometheus combined with Grafana delivers professional-grade monitoring with extensive customization options. This combination works exceptionally well if you're running multiple Raspberry Pis or need detailed historical data analysis. The initial setup takes longer, but the flexibility pays off for complex projects.
Advanced users managing critical infrastructure should consider Zabbix or dedicated monitoring stacks. These enterprise-level solutions provide robust alerting, scalability, and integration capabilities but require significant time investment.
Here's a quick comparison to guide your decision:
Beginner-Friendly: Netdata, Glances - Setup time 15-30 minutes - Best for single Pi monitoring, learning basics
Intermediate: Prometheus and Grafana, InfluxDB - Setup time 1-2 hours - Best for multi-device monitoring, custom dashboards
Advanced: Zabbix, Nagios - Setup time 3+ hours - Best for enterprise environments, complex networks
Consider starting simple and scaling up as your needs grow. Most monitoring tools can run alongside each other, so you're not locked into one choice forever. Match the tool to your immediate project requirements rather than over-engineering from the start. Remember, the best monitoring solution is one you'll actually use consistently.
Monitoring your Raspberry Pi isn't just a nice-to-have feature—it's an essential practice that separates successful long-term projects from those that mysteriously fail at the worst possible moments. Whether you're running a home automation system, a media server, or an educational project, keeping tabs on your device's health gives you peace of mind and prevents unexpected downtime.
The good news? You don't need to be a systems administrator or have years of Linux experience to get started. Begin with something simple like Glances or NetData, which you can set up in less than 15 minutes. These lightweight solutions will immediately show you what's happening with your CPU, memory, and temperature without overwhelming you with unnecessary complexity.
As your comfort level grows and your projects become more ambitious, you can gradually expand your monitoring setup. Add disk space alerts, create custom dashboards, or integrate network monitoring. The beauty of the Raspberry Pi ecosystem is that you can scale your monitoring solution alongside your skills and needs.
Remember, every expert was once a beginner who took that first step. The monitoring tools we've explored in this guide are all actively maintained, well-documented, and supported by helpful communities ready to assist you. Don't let analysis paralysis hold you back—pick a solution that matches your current skill level, follow the installation steps, and start gathering insights today. Your future self will thank you when you catch that storage issue before it crashes your project or identify that memory leak before it causes problems. Take control of your Raspberry Pi projects now and enjoy the confidence that comes with truly understanding what's happening under the hood.