
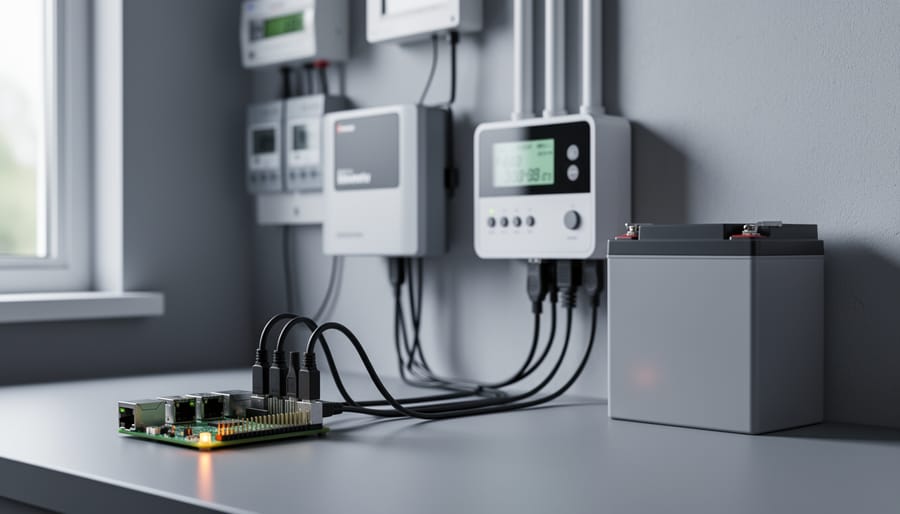
A distributed energy resource management system (DERMS) is software that monitors and coordinates small energy assets, like solar panels, batteries, and smart loads, so they work together instead of independently. You can build a working small-scale version on a Raspberry Pi in an afternoon or two, using free software, a few inexpensive meters, and a basic grasp of MQTT and Python. Difficulty is intermediate, and the main prerequisite is a Pi 4 or newer with a stable network connection.
Utilities run DERMS platforms that manage thousands of rooftop arrays and home batteries at once. Your version does the same job at a smaller scale: it reads what each device is producing or consuming, decides what should happen next, and sends commands back. Think of it as the brain behind a solar-plus-storage setup, one that can shift loads to sunny hours or keep a battery from draining at the wrong moment.
If you’ve already turned your Pi into a smart home hub you’ve got a head start, since the same Pi can host the monitoring and control layer. Below, we’ll cover the tools, the safety and security rules, the ordered build, and how to verify it all works.
What a DERMS Does and Why a Raspberry Pi Is a Good Fit
A distributed energy resource management system does three jobs: it listens, it decides, and it acts. “Distributed energy resources” (DERs) is just the industry term for small, scattered power sources and loads, such as solar inverters, home batteries, EV chargers, and smart plugs.
First, the system collects data. It reads how much your panels are producing, how full the battery is, and what the house is drawing right now. Second, it applies simple rules, like “if solar output beats household demand, there’s surplus to use.” Third, it sends control commands, such as switching on a water heater or pausing an EV charger. At utility scale, this coordinates thousands of devices. At your scale, it’s a handful.
A Raspberry Pi is a great fit for that smaller version. It sips power, so it can run around the clock without wasting the energy you’re trying to manage. Its GPIO pins talk directly to relays and sensor boards, and built-in Ethernet and Wi-Fi make networking painless. The community is huge, so almost every problem you hit has already been solved in a forum thread. Think of it as a compact edge computing hub sitting right next to your equipment.
Let’s be honest about the limits, though. A Pi uses an SD card or SSD that can wear out, has no built-in redundancy, and lacks the industrial certifications, ruggedness, and guaranteed uptime of commercial controllers. It also isn’t meant to manage safety-critical protection functions. Use it to watch, learn, and gently coordinate, and leave protection duties to the gear designed for them.
Tools and Materials You’ll Need for Your Pi-Based Energy Hub
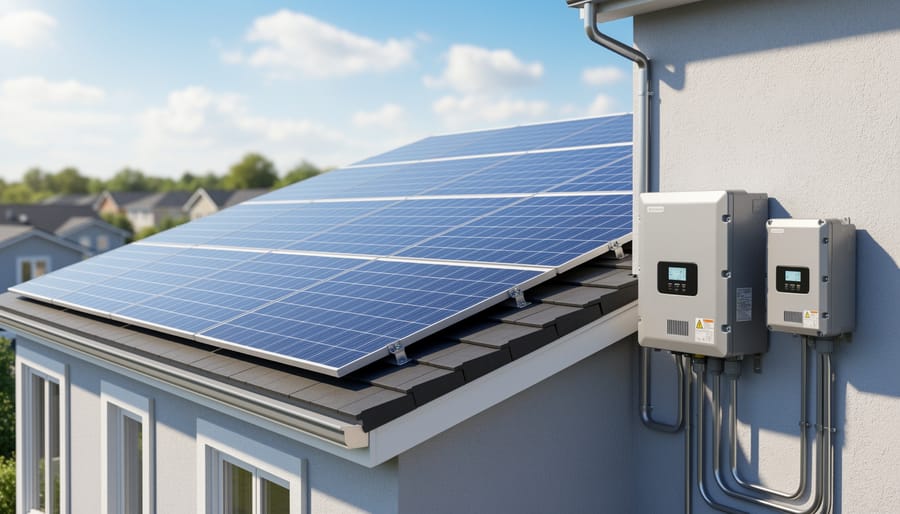
Choosing the Right Raspberry Pi Model for Energy Monitoring
Not every energy monitoring project needs the newest board. The workload is light: polling sensors, running a message broker, and logging readings. What matters most is steady, 24/7 reliability.
A Raspberry Pi 4 (2 GB or 4 GB) is the safe middle ground. It runs Mosquitto, Node-RED, InfluxDB, and Grafana together without much strain, and it has years of community troubleshooting behind it. A Pi 5 gives you extra headroom for longer dashboards, bigger databases, or adding Home Assistant on top. The trade-off is a higher price and a bit more power draw, which matters if your hub runs on a battery-backed supply. A Pi 3B+ can still work for a single-sensor setup, but expect sluggish Grafana loads and tight memory once the full stack is running.
Storage matters more than raw speed. MicroSD cards wear out under constant database writes, so for always-on use, boot from a USB SSD or a high-endurance card instead. Time-series logging is exactly the kind of write-heavy job that kills cheap cards.
For beginners, pick a Pi 4 with 4 GB and an SSD. It keeps things simple, and you can upgrade later without redoing your setup.
Safety Warnings and Security Basics Before You Connect Anything
Before you plug a single sensor into your Pi, treat safety and security as two separate checklists. One protects you from electrical hazards, the other protects your network from the outside world.
Electrical safety first. Never work on live mains or on the high-voltage DC from solar arrays and batteries. Solar panels produce voltage whenever there’s light, even with the inverter off. Choose isolated sensors, such as clamp-style current transformers or a meter with a data port, so your Pi never touches a power circuit directly. Any wiring at a breaker panel or inverter belongs to a licensed electrician, and you should check local codes and your equipment warranty terms before adding anything to the system.
Set one firm stop condition: if you’re unsure about any connection, power everything down and get help. A paused project costs you an afternoon. A wiring mistake can cost far more.
Lock down the network. Your energy hub reports on and may control real equipment, so give it the same care as any internet-facing machine:
– Change every default password right away.
– Disable services you don’t use.
– Log in over SSH with keys instead of passwords.
– Turn on a firewall and open only the ports you need.
– Keep the OS updated.
– Put the energy gear on its own VLAN or separate subnet, away from laptops and phones.
If you plan to tie this into your wider [home automation](https://pidora.ca/transform-your-home-into-a-smart-hub-with-your-raspberry-pi/) setup, that isolation matters even more.
Finally, secure your message broker. Require a username and password for Mosquitto, and encrypt traffic with MQTT with TLS so no one can read or tamper with your readings and commands.
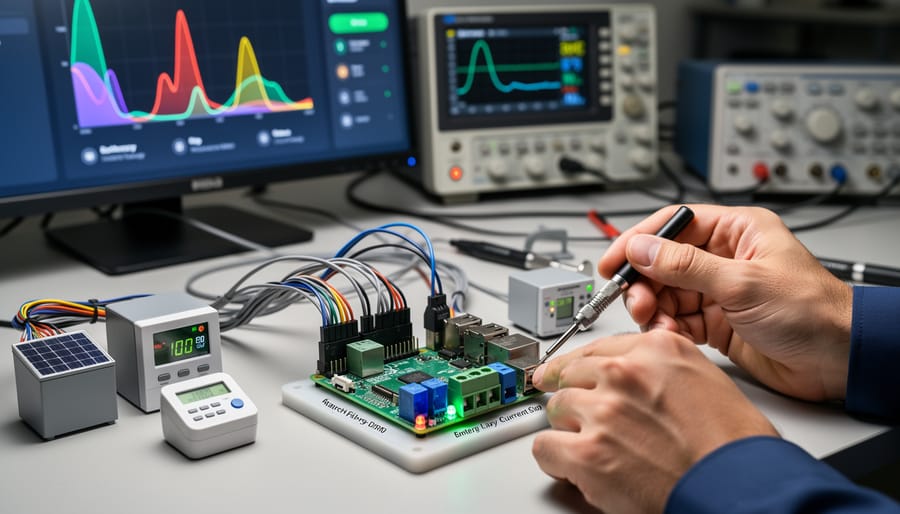
Step-by-Step: Build Your Raspberry Pi DERMS from Scratch
Set Up and Secure Raspberry Pi OS
Start by flashing Raspberry Pi OS Lite (64-bit) to your microSD card or SSD with Raspberry Pi Imager. Before writing, open the advanced settings and set a hostname, create your own username, enable SSH, and add your Wi-Fi details if you aren’t using Ethernet. This skips the default “pi” login entirely, which is the first security win.
Once the Pi boots, connect over SSH and bring everything up to date:
1. Run sudo apt update && sudo apt full-upgrade -y, then reboot.
2. On your computer, generate a key with ssh-keygen -t ed25519, then copy it over using ssh-copy-id.
3. Edit /etc/ssh/sshd_config and set PasswordAuthentication no, then restart SSH.
4. Give the Pi a static IP by reserving an address in your router, or by setting one in NetworkManager.
5. Install ufw, allow only SSH for now, and enable it.
A fixed address matters because your sensors and dashboards will keep looking for the Pi in the same place. A quick reboot test confirms it all survives a restart.
Install the Messaging and Data Stack
Now that your Pi is locked down, it’s time to install the four pieces that move and store your energy data. Each one has a simple job.
1. Mosquitto is your MQTT broker, a small post office. Sensors publish readings to named topics (like `energy/solar/watts`), and anything subscribed to that topic receives them. If you want a deeper look at how this works, our guide to [IoT messaging](https://pidora.ca/transform-your-raspberry-pi-into-a-powerful-edge-computing-hub-for-iot/) covers it well.
2. InfluxDB is a time-series database, built to store values stamped with the time they were recorded.
3. Grafana turns that stored data into live dashboards.
4. Node-RED is the glue, a visual tool where you wire together flows that listen to MQTT, save to InfluxDB, and later apply control rules.
Install the first two from the command line:
“`
sudo apt install mosquitto mosquitto-clients
sudo systemctl enable –now mosquitto
“`
Add InfluxDB, Grafana, and Node-RED by following each project’s official Raspberry Pi instructions, since repository details change. Prefer an all-in-one option? Home Assistant can replace Node-RED and Grafana, though it hides more of the plumbing.
The data flows in one direction: sensor, Mosquitto, Node-RED, InfluxDB, Grafana. Create a Mosquitto username and password now, before connecting anything.
Connect Your Energy Sensors and Meters
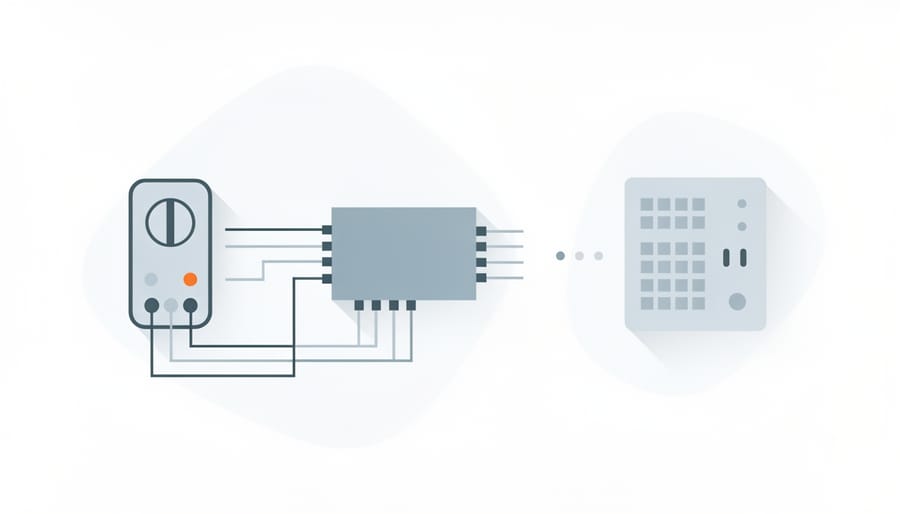
Start with the safest path: use isolated, low-voltage sensors, or a Modbus energy meter that an electrician has already installed. Never splice into mains wiring yourself. If your meter or inverter exposes a serial port, a USB-to-RS485 adapter plugs straight into the Pi and keeps everything electrically separate.
For a Modbus meter, connect the adapter’s A and B terminals to the meter’s matching pair, then install the library with `pip install pymodbus paho-mqtt`. Check the meter’s manual for its register map, since addresses vary by model. Using CT clamps instead? Pair them with an ADS1115 ADC board and a voltage-output burden resistor, as the clamp’s datasheet specifies.
Here’s a minimal script pattern:
“`python
from pymodbus.client import ModbusSerialClient
import paho.mqtt.publish as publish
client = ModbusSerialClient(port=”/dev/ttyUSB0″, baudrate=9600)
client.connect()
result = client.read_input_registers(0, 2, slave=1)
watts = result.registers[0]
publish.single(“home/solar/power_w”, watts, hostname=””)
“`
Adjust the register address and slave ID to match your device. Then repeat the pattern for battery state of charge and household load, publishing each to its own topic, such as `home/battery/soc` and `home/load/power_w`.
Run the script every 10 to 15 seconds from a systemd timer or a simple loop. Once readings appear in a Mosquitto subscriber (`mosquitto_sub -t “home/#”`), your sensors are talking to the hub.
Visualize Generation, Storage, and Consumption
Your readings are already flowing through MQTT, so the next job is giving them a home and a face. Start by having Node-RED (or Telegraf, if you prefer) subscribe to your energy topics and write each value into InfluxDB. Keep your naming consistent: one measurement called “energy” with tags like source=solar, source=battery, and source=load makes querying much easier later.
In Grafana, add InfluxDB as a data source, then create a new dashboard. Begin with three panels:
– A time-series graph for solar output in watts
– A gauge for battery state of charge, with red below 20 percent and green above 60
– A second time-series graph for household load
Overlay solar and load on a single graph and you’ll see at a glance when you’re producing more than you use. That surplus is exactly what your control rules will act on in the next step.
To keep things readable, limit each panel to two or three lines, use clear units (W, kWh, %), and set the refresh to 10 or 30 seconds rather than every second. Add a “last 24 hours” view as your default, and save a weekly view for spotting trends.
Add Simple Coordination and Control Rules
Now for the part that makes this a management system rather than just a monitor: rules. A rule watches your readings and decides what should happen next. In Node-RED, that means a short flow. An MQTT input node listens to your solar production and household consumption topics, a function node does the math, and an output node sends a message or flips a switch.
Start with alerts, not control. Build a flow that watches battery state of charge and sends you a notification when it drops below, say, 20 percent. It’s harmless, and it teaches you whether your data is trustworthy. Let it run for a week or two. If the alerts match reality, you’re ready for the next step.
Once you trust your numbers, try a simple surplus rule. Subtract consumption from solar production, and if the difference stays above about 1,500 watts for five minutes, publish an “on” command to a smart plug running a water heater or EV charger. Switch it off when the surplus disappears. That delay matters, because passing clouds will otherwise make your plug flicker on and off.
Prefer Python? The same logic fits in a short script using the paho-mqtt library. Either way, keep your rules small, test them with simulated values first, and only automate loads you’d be comfortable controlling by hand.
Verify It Works and Where to Go Next
Before you trust your new energy hub, prove it works. A dashboard full of confident-looking numbers means nothing until you’ve checked them against something you already trust. Work through this checklist:
- Pi readings match your inverter display or a trusted reference meter, within a few percent.
- MQTT messages arrive on the right topics at the expected interval (watch them live with
mosquitto_sub). - The Grafana dashboard updates in real time and keeps a sensible history.
- Alerts and control rules trigger correctly when you feed them safe, simulated values.
- The whole system comes back on its own after you pull the power and reboot.
Start with the simplest check: stand next to the inverter, read its display, and compare it with your dashboard. If the two disagree by a wide margin, suspect your sensor scaling or calibration before anything else. For rules, don’t wait for a real battery to drain. Publish a fake low-charge reading to your MQTT topic and confirm the alert fires. Do the same for your solar-surplus rule, and keep any real appliance unplugged while you test.
The reboot test matters more than most beginners expect. A hub that needs a manual restart after every power blip isn’t much use. Make sure your services start automatically and your static IP sticks.
Once everything holds steady, you’ve got room to grow:
– Pull in weather forecast data to predict tomorrow’s solar output.
– Link several sites into one view, which is where this starts to feel like a real DERMS.
– Try simple battery scheduling around cheap or surplus energy.
– Tighten security further with TLS on every connection and tighter firewall rules.
Pick one upgrade at a time and keep verifying as you go.
Troubleshooting and Frequently Asked Questions
Building a Pi-based energy hub raises a few predictable questions, and most have simple answers. Here are the ones beginners ask most often.
Can a Raspberry Pi control a real inverter?
Sometimes. Many inverters expose a Modbus or vendor API that a Pi can read, but writing control commands depends on your model and its warranty terms, so start read-only and check the manufacturer’s documentation first.
How much power does the Pi itself use?
Very little, typically a few watts for a Pi 4 or Pi 5 under light monitoring loads. Check your model’s official specifications and measure it with a plug-in meter if you want a precise figure.
Is a Pi-based DERMS suitable for classrooms?
Yes, as long as you use low-voltage, isolated sensors and simulated data rather than live mains wiring. It’s a safe way to teach how generation, storage, and load interact.
How does it compare with Home Assistant alone or commercial systems?
Home Assistant is easier to set up and has ready-made integrations, while a custom build teaches you more and gives finer control. Commercial systems add certified hardware, support, and scale that a hobby hub can’t match.
My sensor readings look wrong. What should I check?
Compare them against the inverter display or a trusted meter, then check wiring, CT clamp orientation, scaling factors, and your script’s unit conversions. Test with known values before trusting any automation rule.
How do I keep my data safe from remote access?
Keep the hub off the open internet. Use SSH keys, a firewall, an isolated network, and authenticated, TLS-secured MQTT, and reach it remotely only through a VPN.
If something still misbehaves, work backward along the data path: sensor, script, MQTT topic, database, dashboard. Checking each hop in order usually reveals where the numbers go astray. Don’t be discouraged by a few false starts. Debugging is a big part of the learning, and it’s the same skill you’ll use in other educational projects on the Pi.
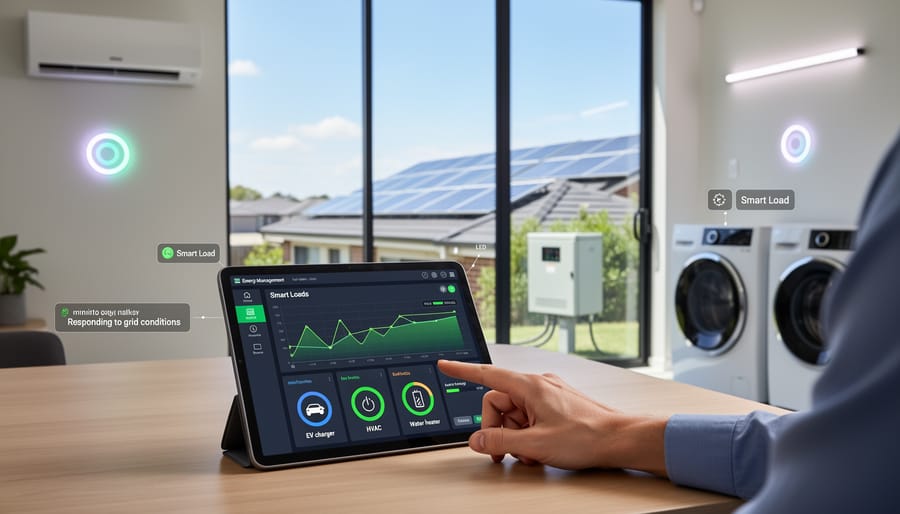
You started with a bare Raspberry Pi and ended up with a working energy hub. It reads solar output, battery level, and household load, stores the history, shows it on a dashboard, and acts on simple rules. That’s the core loop of a distributed energy resource management system, just scaled down to something you can hold in one hand.
The real payoff is understanding. Once you’ve watched your own sensor data flow through MQTT into Grafana and trigger a smart plug, terms like “coordination” and “demand response” stop being abstract. Raspberry Pi in Renewable Energy Management is one of the friendliest ways to learn how these systems fit together.
Keep two habits as you expand. Treat electrical safety as non-negotiable, and call a licensed electrician for anything touching mains or inverter wiring. Keep your network locked down with strong credentials, key-based SSH, and authenticated MQTT.
Built something interesting? Share your project, then browse more Pidora tutorials for your next build.