

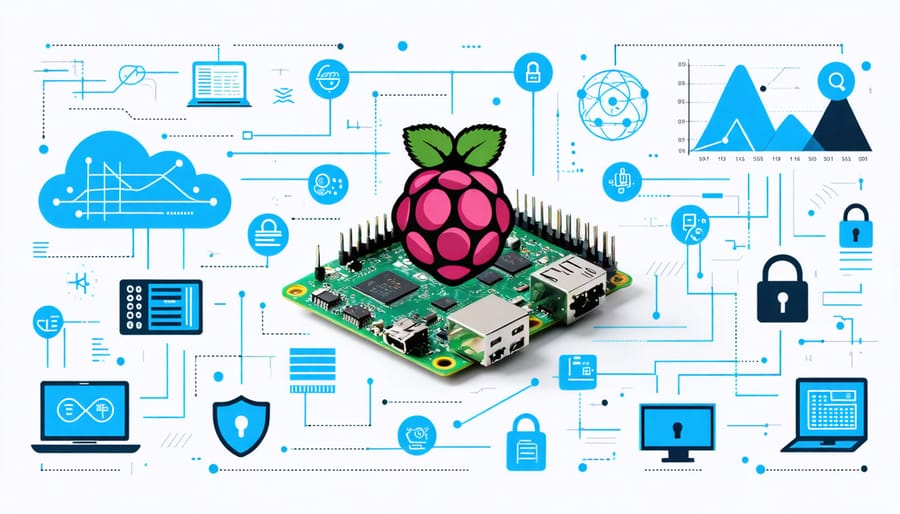
Transform your home network into a professional-grade monitoring system with a Raspberry Pi, delivering enterprise-level visibility for under $100. This compact yet powerful setup enables real-time tracking of bandwidth usage, device connections, and potential security threats across your entire network infrastructure.
Modern network monitoring demands sophisticated tools, but expensive commercial solutions often exceed home users’ budgets. The Raspberry Pi offers a perfect balance – combining affordability with powerful monitoring capabilities through open-source tools like Prometheus, Grafana, and Pi-hole. Whether you’re troubleshooting connectivity issues, tracking bandwidth hogs, or securing your network against unauthorized access, a Raspberry Pi-based monitoring solution provides enterprise-grade insights at a fraction of the cost.
This comprehensive guide walks through setting up a complete network monitoring system using readily available hardware and free software tools. From basic traffic analysis to advanced intrusion detection, you’ll learn how to harness the full potential of your Raspberry Pi to create a robust network monitoring solution that rivals commercial alternatives.
Essential Hardware and Software Requirements
Recommended Raspberry Pi Models
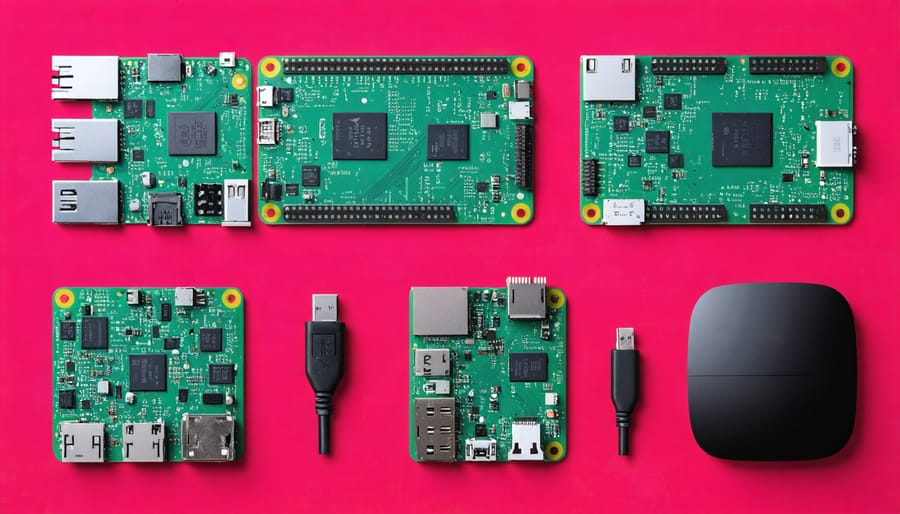
For network monitoring tasks, the Raspberry Pi 4 Model B stands out as the top choice, thanks to its robust processing power and Gigabit Ethernet port. With options for 2GB, 4GB, or 8GB of RAM, the 4GB variant offers the best balance of performance and cost for most monitoring setups.
The Raspberry Pi 3B+ can also serve as a capable alternative for basic monitoring needs, offering decent performance at a lower price point. However, its limited RAM and slower network speeds may impact performance when running multiple monitoring tools simultaneously.
For budget-conscious users, the Pi Zero W can handle lightweight monitoring tasks, but its limited processing power and WiFi-only connectivity make it suitable only for basic network scanning and simple monitoring applications.
When choosing your Pi model, consider your network size and monitoring requirements. For home networks with up to 20 devices, any of these models will work well, but larger networks or more intensive monitoring needs will benefit from the Pi 4’s superior capabilities.
Network Monitoring Software Options
When it comes to monitoring your home network with a Raspberry Pi, several powerful software options are available. Let’s explore some of the most popular and effective tools that can transform your Pi into a network monitoring powerhouse.
Nagios is a veteran in the network monitoring space, offering comprehensive monitoring capabilities. While it has a steeper learning curve, it provides detailed insights into network performance, device status, and system metrics. The Core version is free and open-source, making it an excellent choice for home networks. It can monitor everything from bandwidth usage to server health and send notifications when issues arise.
Zabbix offers a more modern approach to network monitoring with an intuitive web interface. It’s particularly good at automated discovery of network devices and creating visual representations of your network topology. The software excels at collecting data from various sources and presenting it through customizable dashboards, making it easier to spot trends and potential problems.
Pi-hole stands out as a unique option that combines network monitoring with ad-blocking capabilities. While primarily known for blocking ads at the network level, Pi-hole also provides valuable insights into DNS queries, network traffic patterns, and connected devices. Its user-friendly interface makes it an excellent choice for beginners while offering enough depth for advanced users.
For those just starting, Cacti offers a straightforward approach to network monitoring with a focus on graphing and trending. It’s particularly useful for tracking bandwidth usage and creating visual representations of network performance over time.
These tools can be used independently or in combination, depending on your specific monitoring needs and technical expertise.
Setting Up Your Monitoring System
Initial System Configuration
Begin by flashing the latest Raspberry Pi OS Lite onto your microSD card using the Raspberry Pi Imager. This lightweight version is ideal for our monitoring setup as it doesn’t include unnecessary desktop components. Before ejecting the card, enable SSH by creating an empty file named ‘ssh’ in the boot partition.
Connect your Raspberry Pi to your network using an Ethernet cable for a stable connection. While Wi-Fi is possible, a wired connection provides better reliability for continuous monitoring. Power up your Pi and wait about two minutes for it to complete its initial boot sequence.
Find your Pi’s IP address by checking your router’s DHCP client list or using a network scanner. Connect to your Pi via SSH using the default credentials (username: pi, password: raspberry). Immediately change these default credentials using the passwd command for security.
Update your system by running:
“`
sudo apt update
sudo apt upgrade -y
“`
Configure your Pi’s basic settings using:
“`
sudo raspi-config
“`
Here, set your timezone, expand the filesystem if needed, and adjust memory split settings. For network monitoring, the default memory split is sufficient. Reboot your Pi when prompted to apply all changes.
This initial configuration provides a solid foundation for installing and configuring network monitoring tools in the subsequent steps.
Installing Monitoring Tools
Now that your Raspberry Pi is set up, it’s time to install the necessary system monitoring tools and software. Start by updating your system to ensure you have the latest packages:
sudo apt update && sudo apt upgrade -y
For comprehensive network monitoring, we’ll install three essential tools: Prometheus, Node Exporter, and Grafana. First, install Prometheus:
wget https://github.com/prometheus/prometheus/releases/download/v2.37.0/prometheus-2.37.0.linux-armv7.tar.gz
tar xvf prometheus-2.37.0.linux-armv7.tar.gz
sudo mv prometheus-2.37.0.linux-armv7 /opt/prometheus
Next, install Node Exporter to collect system metrics:
wget https://github.com/prometheus/node_exporter/releases/download/v1.3.1/node_exporter-1.3.1.linux-armv7.tar.gz
tar xvf node_exporter-1.3.1.linux-armv7.tar.gz
sudo mv node_exporter-1.3.1.linux-armv7 /opt/node_exporter
Finally, install Grafana for visualization:
wget https://dl.grafana.com/oss/release/grafana-8.5.2.linux-armv7.tar.gz
tar xvf grafana-8.5.2.linux-armv7.tar.gz
sudo mv grafana-8.5.2 /opt/grafana
Create necessary service files for each tool to ensure they start automatically on boot. Remember to set appropriate permissions and enable the services:
sudo systemctl enable prometheus
sudo systemctl enable node_exporter
sudo systemctl enable grafana-server
Once all services are running, you can access the Grafana interface through your web browser at http://your-pi-ip:3000 using the default login credentials (admin/admin).
Configuring Alert Systems
An effective alert system is crucial for monitoring your home network, ensuring you’re promptly notified of any issues or suspicious activities. Setting up alerts on your Raspberry Pi monitoring system involves configuring multiple notification channels and defining trigger conditions.
Start by configuring email notifications, which serve as a reliable baseline alert method. Install the ‘msmtp’ package for email functionality and set up your preferred email service credentials. For immediate notifications, consider implementing push notifications through services like Pushbullet or Telegram, which can deliver alerts directly to your mobile device.
Create custom alert triggers based on specific network conditions:
– Network connectivity loss
– Unusual bandwidth spikes
– New device connections
– High CPU/memory usage on monitored devices
– Failed login attempts
– Ping response times exceeding thresholds
For each trigger, define appropriate thresholds and alert priorities. Critical issues like network outages should trigger immediate notifications, while less urgent matters can be bundled into daily summary reports.
Consider implementing a progressive alert system:
1. Warning notifications for minor issues
2. Alert notifications for moderate problems
3. Critical alerts for serious network threats
To avoid alert fatigue, set up smart filtering rules that prevent duplicate notifications and implement cool-down periods between alerts. You can also create different notification schedules for different times of day, ensuring you’re not disturbed by non-critical alerts during sleeping hours.
Remember to regularly test your alert system and adjust thresholds based on your network’s normal behavior patterns. This helps reduce false positives while ensuring you catch genuine issues promptly.
Advanced Monitoring Features
Network Traffic Analysis
Understanding your home network’s traffic patterns is crucial for maintaining security and optimizing performance. With your Raspberry Pi monitoring setup, you can gain valuable insights into how your network is being used and identify potential issues before they become problems.
Using tools like Wireshark or tcpdump, your Raspberry Pi can capture and analyze network packets in real-time. This allows you to see which devices are consuming the most bandwidth, what types of traffic are flowing through your network, and whether there are any suspicious communication patterns that might indicate security threats.
One of the most valuable aspects of traffic analysis is the ability to identify bandwidth hogs and unusual traffic spikes. For example, you might discover that a smart TV is constantly streaming data even when not in use, or that certain devices are making unexpected connections to external servers. This information is invaluable for implementing effective network optimization projects and security measures.
To make sense of the collected data, consider setting up visualization tools like Grafana or Elasticsearch. These platforms can transform raw traffic data into easy-to-understand graphs and charts, making it simpler to spot trends and anomalies. You can track metrics such as:
– Daily/hourly bandwidth usage per device
– Most frequently accessed websites and services
– Peak usage times and patterns
– Protocol distribution (HTTP, HTTPS, DNS, etc.)
– Unusual port activity
Remember to configure alerts for specific events, such as when traffic exceeds normal thresholds or when potentially malicious patterns are detected. This proactive approach to network monitoring ensures you’re always aware of what’s happening on your network and can respond quickly to any issues that arise.

Security Monitoring
Securing your home network is crucial, and your Raspberry Pi can serve as an effective security monitoring station. By implementing intrusion detection systems (IDS) like Snort or Suricata, you can actively monitor network traffic for suspicious activities and potential security threats.
Start by installing and configuring Snort on your Raspberry Pi. This powerful IDS can detect various network attacks, including port scans, malware infections, and unauthorized access attempts. Create custom rules to match your network’s specific security requirements and set up automated alerts for suspicious activities.
For enhanced security, consider implementing a secure VPN configuration alongside your monitoring setup. This adds an extra layer of protection by encrypting your network traffic and preventing unauthorized access to your monitoring data.
Install fail2ban to protect against brute force attacks by automatically blocking IP addresses that show suspicious behavior. Configure your Pi to maintain detailed logs of all security events, which can be invaluable for analyzing potential breaches and improving your security measures.
Consider setting up network segregation using VLANs to isolate potentially vulnerable IoT devices from your main network. Your Raspberry Pi can monitor traffic between these segments and alert you to any unusual cross-network communication.
Remember to regularly update your security rules and signatures to protect against new threats. Configure email or push notifications to receive immediate alerts when security incidents occur, allowing you to respond quickly to potential threats.
Performance Optimization
To maintain optimal performance of your Raspberry Pi network monitoring system, regular maintenance and thoughtful configuration are essential. Start by implementing log rotation to prevent your storage from filling up with monitoring data. Configure your logging settings to retain only necessary information and automatically archive or delete older logs after a specified period.
Memory management is crucial for smooth operation. Monitor your Pi’s RAM usage regularly and consider using lightweight monitoring tools that don’t strain system resources. If you’re running multiple monitoring services, stagger their execution times to prevent resource conflicts and system overload.
Database optimization plays a vital role in system performance. Regularly purge unnecessary data and optimize your database queries. For time-series databases like InfluxDB, consider implementing data retention policies to automatically manage historical data.
Temperature management is often overlooked but critical. Ensure proper ventilation for your Raspberry Pi, especially if it’s running 24/7. Consider adding a small cooling fan if temperatures consistently exceed 70°C. High temperatures can lead to throttling and reduced performance.
Network bandwidth optimization is equally important. Configure your monitoring intervals thoughtfully – not every metric needs to be checked every minute. Prioritize critical services for frequent monitoring while reducing the polling frequency for less crucial metrics.
Lastly, implement automated health checks for your monitoring system itself. Set up alerts to notify you of potential issues like high CPU usage, low disk space, or service failures. Regular system updates and security patches should be part of your maintenance routine, but always test updates in a controlled environment first to avoid disrupting your monitoring setup.
Remote Access and Control
Remote access to your Raspberry Pi network monitoring system is essential for checking your network status and making configuration changes from anywhere. To get started, you’ll need to set up SSH (Secure Shell) access, which provides a secure command-line connection to your Pi.
First, enable SSH on your Raspberry Pi through the raspi-config utility or by creating an empty file named ‘ssh’ in the boot partition. Then, set up port forwarding on your router to direct incoming SSH traffic (default port 22) to your Pi’s local IP address. For enhanced security, consider changing the default SSH port and implementing key-based authentication instead of password login.
For those who prefer a graphical interface, following a comprehensive remote desktop access setup guide will help you establish VNC (Virtual Network Computing) connectivity. This allows you to view and control your Pi’s desktop environment remotely.
To further secure your remote access:
– Use a strong password for your Pi user account
– Set up a firewall (like UFW) to restrict incoming connections
– Consider implementing fail2ban to prevent brute force attacks
– Use a Dynamic DNS service if your home IP address changes frequently
For mobile access, several apps can connect to your Pi via SSH or VNC. Popular choices include JuiceSSH for Android and Termius for iOS. These tools make it convenient to check your network status and receive alerts while on the go.
Remember to regularly update your security settings and monitor access logs to maintain a secure remote connection to your network monitoring system.
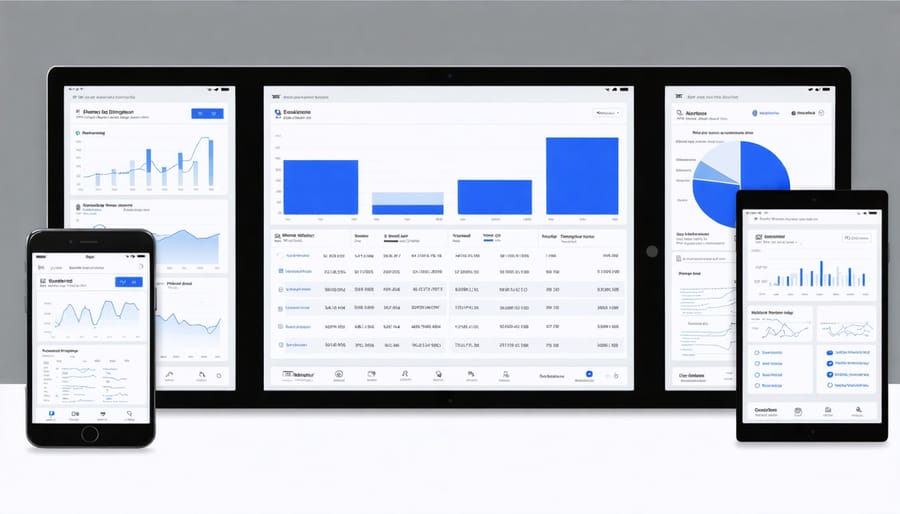
Setting up a Raspberry Pi for home network monitoring is a rewarding project that offers substantial benefits for network security and performance optimization. By implementing this solution, you gain real-time visibility into your network traffic, potential security threats, and device behavior patterns. The relatively low cost of hardware combined with powerful open-source monitoring tools makes this an excellent choice for both beginners and advanced users.
To get started with your own network monitoring system, begin by gathering the necessary hardware components and choosing your preferred monitoring software. Consider starting with basic traffic monitoring and gradually expanding to more advanced features like intrusion detection and bandwidth analysis as you become more comfortable with the system.
Remember to regularly update your monitoring tools and Raspberry Pi operating system to ensure optimal security and performance. You might also want to explore creating custom dashboards and alert systems to match your specific monitoring needs. With proper setup and maintenance, your Raspberry Pi network monitoring solution will provide valuable insights into your home network’s health and security for years to come.
Take the first step today by setting up your Raspberry Pi, and join the growing community of home network monitoring enthusiasts who are taking control of their network security and performance.