

Embark on an exciting DIY project with the Raspberry Pi Pico – a powerful, low-cost microcontroller that’s perfect for building your own weather station. With its compact size, versatile features, and easy programmability, the Pico makes it simple to create a sophisticated device that measures temperature, humidity, pressure and more. By combining affordable sensors, a little coding know-how, and some creative problem-solving, you can craft a personalized weather station that provides accurate, real-time data about your local environment. Whether you’re a beginner looking to dive into the world of microcontrollers or an experienced maker seeking a new challenge, this Raspberry Pi Pico weather station project will expand your skills, satisfy your curiosity, and give you a practical, impressive device to call your own. Get ready to unleash your inner inventor and discover the power of the Pico in this hands-on guide to building your very own high-tech weather station from scratch.
Gathering Your Components
Essential Hardware
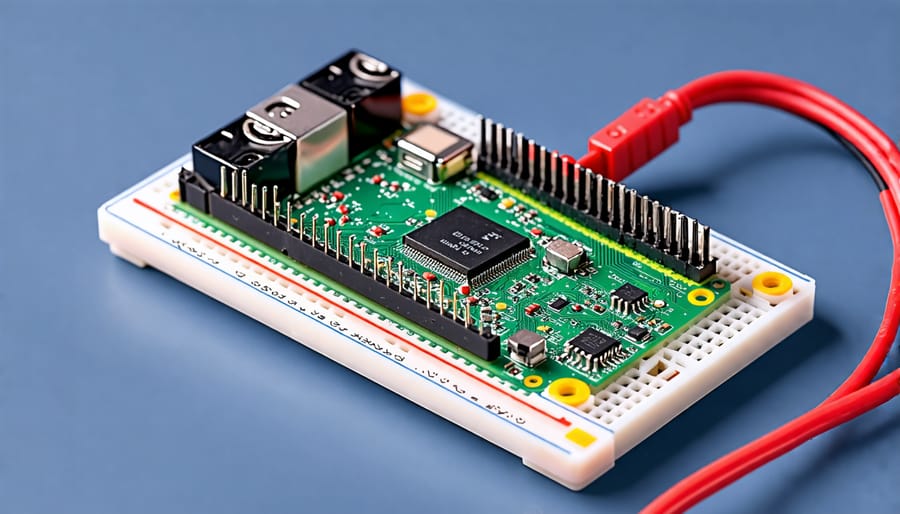
The Raspberry Pi Pico is the heart of your weather station project. This tiny, affordable microcontroller board offers ample processing power and GPIO pins to interface with various sensors. To get started, you’ll also need a breadboard and jumper wires for prototyping and connecting components. When it comes to weather sensors, you have several options depending on the measurements you want to take. A DHT11 or DHT22 sensor is perfect for capturing temperature and humidity data, while a BMP280 or BME280 sensor can measure atmospheric pressure. For wind speed and direction, consider using an anemometer and wind vane sensor. A rain gauge sensor is essential for tracking precipitation. Lastly, don’t forget to include a power source, such as a micro-USB cable or battery pack, to keep your Pico running smoothly.

Optional Enhancements
To take your Raspberry Pi Pico weather station to the next level, consider adding optional enhancements. A display, such as an OLED or LCD screen, can show real-time weather data, making it easier to monitor conditions at a glance. Integrating solar power can make your weather station self-sufficient and eco-friendly, allowing it to operate without relying on external power sources. Wireless connectivity, such as Wi-Fi or Bluetooth, enables remote access to weather data and integration with other smart home devices. You can also explore adding additional sensors for measuring UV index, air quality, or wind speed and direction. These enhancements not only expand the functionality of your weather station but also provide opportunities for further customization and learning. As you gain more experience with the Raspberry Pi Pico, you can experiment with these advanced features to create a truly personalized and powerful weather monitoring system.
Step-by-Step Assembly Guide
Assembling your Raspberry Pi Pico weather station is a straightforward process that can be accomplished with a few simple steps. Begin by gathering all the necessary components, including the Raspberry Pi Pico, BME280 sensor, LCD display, and jumper wires.
First, connect the BME280 sensor to the Raspberry Pi Pico. Using jumper wires, connect the VCC pin of the sensor to the 3V3 pin on the Pico, the GND pin to any GND pin on the Pico, the SCL pin to GP1, and the SDA pin to GP0. These connections enable the Pico to communicate with the sensor using the I2C protocol.
Next, connect the LCD display to the Pico. The LCD display typically uses the SPI communication protocol. Connect the VCC pin of the LCD to the 3V3 pin on the Pico, the GND pin to any GND pin, the SCL pin to GP2, the SDA pin to GP3, and the CS pin to GP4. If your LCD display has a backlight pin, connect it to the 3V3 pin through a current-limiting resistor (usually supplied with the display).
Once the wiring is complete, double-check all connections to ensure they are secure and correct. Refer to the wiring diagram provided in the project repository for visual guidance.
With the hardware assembled, it’s time to move on to programming the Raspberry Pi Pico. The Pico can be programmed using MicroPython, a compact version of the Python programming language specifically designed for microcontrollers. Follow the instructions in the project repository to install MicroPython on your Pico and upload the weather station code.
The weather station code is designed to read data from the BME280 sensor, display the current temperature, humidity, and pressure readings on the LCD, and optionally send the data to a remote server for logging and analysis. The code is well-commented and can be easily modified to suit your specific needs.
After uploading the code, your Raspberry Pi Pico weather station is ready for deployment. Choose a suitable location for your weather station, ensuring that the sensor is protected from direct sunlight and rain while still allowing for accurate readings. Power up the Pico using a USB power supply or battery pack, and watch as your weather station springs to life, displaying real-time weather data on the LCD.
With your Raspberry Pi Pico weather station up and running, you can explore various ways to expand and enhance the project. Consider adding additional sensors, such as a rain gauge or wind speed sensor, to provide more comprehensive weather data. You can also integrate your weather station with home automation systems or create a web-based dashboard to monitor the weather remotely.
By following these step-by-step instructions and referring to the provided wiring diagrams and project repository, you’ll be well on your way to creating your own Raspberry Pi Pico weather station. This beginner-friendly project is an excellent introduction to the world of microcontrollers, sensors, and data logging, and it opens up a world of possibilities for further exploration and innovation.

Programming Your Weather Station
Now that your Raspberry Pi Pico weather station is assembled, it’s time to bring it to life by programming it to read sensor data, process the information, and output meaningful weather insights. Don’t worry if you’re new to coding – we’ll guide you through the process step by step.
To get started, you’ll need to set up the Raspberry Pi Pico’s development environment. We recommend using Thonny, a beginner-friendly Python IDE that comes pre-installed with Raspberry Pi OS. Connect your Pico to your computer via USB and open Thonny. Ensure that the interpreter is set to “MicroPython (Raspberry Pi Pico).”
Next, import the necessary libraries for your sensors. In this example, we’ll use the DHT library for the temperature and humidity sensor and the BMP280 library for the barometric pressure sensor. You can install these libraries directly from within Thonny.
Now, let’s dive into the code. Start by initializing the sensors and setting up the pins they’re connected to. For the DHT sensor, you’ll need to specify the data pin and sensor type (DHT11 or DHT22). The BMP280 sensor communicates via I2C, so you’ll need to initialize the I2C bus and provide the sensor’s address.
With the sensors initialized, you can read the data using simple function calls. The DHT library provides `read()` functions for temperature and humidity, while the BMP280 library offers methods like `read_temperature()`, `read_pressure()`, and `read_altitude()`.
To make the data more meaningful, you can perform calculations and conversions. For example, convert the temperature from Celsius to Fahrenheit, or calculate the dew point and heat index based on the temperature and humidity readings.
Once you have processed the data, it’s time to output the information. You can display the readings on the Pico’s built-in LED, an attached LCD, or send the data to a web server for remote monitoring. In this tutorial, we’ll use an I2C LCD to display the weather data.
Initialize the LCD and create functions to clear the screen and print text at specific positions. Then, in your main loop, call the sensor reading and data processing functions, and display the results on the LCD.
Here’s a simplified example of the code:
“`python
from machine import Pin, I2C
from dht import DHT11
from bmp280 import BMP280
from lcd_api import LcdApi
from pico_i2c_lcd import I2cLcd
# Initialize sensors and LCD
dht_sensor = DHT11(Pin(15))
i2c = I2C(0, sda=Pin(0), scl=Pin(1), freq=400000)
bmp280 = BMP280(i2c)
I2C_ADDR = 0x27
I2C_NUM_ROWS = 2
I2C_NUM_COLS = 16
lcd = I2cLcd(i2c, I2C_ADDR, I2C_NUM_ROWS, I2C_NUM_COLS)
while True:
# Read sensor data
temp, hum = dht_sensor.read()
pressure = bmp280.read_pressure() / 100
# Process data
temp_f = temp * 9/5 + 32
# Display data on LCD
lcd.clear()
lcd.move_to(0, 0)
lcd.putstr(f”Temp: {temp_f:.1f}F”)
lcd.move_to(0, 1)
lcd.putstr(f”Humidity: {hum:.1f}%”)
# Delay before next reading
utime.sleep(2)
“`
This is just a starting point – you can expand on this code to add more sensors, perform advanced calculations, or incorporate weather forecasting algorithms. The possibilities are endless! Happy coding, and enjoy your new Raspberry Pi Pico weather station.
Deployment and Testing
When deploying your Raspberry Pi Pico weather station, finding the optimal location is crucial for accurate readings. Consider a spot that is away from direct sunlight, heat sources, and obstructions like buildings or trees. Aim for an open area with good air circulation to ensure representative measurements of temperature, humidity, and wind speed.
To protect your weather station from the elements, you can use a weatherproof enclosure or build a simple shelter using materials like plastic or wood. Ensure that the enclosure allows for proper ventilation while shielding the components from rain, snow, and debris. Regular maintenance, such as cleaning the sensors and checking for any damage, will help prolong the life of your weather station.
Before relying on your weather station’s data, it’s essential to verify its accuracy. Start by calibrating the sensors according to the manufacturer’s instructions. You can then compare your station’s readings to official weather sources in your area, such as local weather stations or online weather services. Keep in mind that slight variations are expected due to differences in location and equipment.
If you notice significant discrepancies, double-check your wiring and code for any errors. You can also consider using calibration libraries or algorithms to fine-tune your sensors’ readings. Over time, regularly compare your weather station’s data with official sources to ensure it remains accurate and reliable.
By carefully selecting your weather station’s location, protecting it from the elements, and regularly verifying its accuracy, you’ll be able to collect meaningful and trustworthy data for your projects and experiments. With a well-deployed and maintained Raspberry Pi Pico weather station, you’ll be ready to explore the fascinating world of weather monitoring and analysis.
Next Steps and Expansions
Your Raspberry Pi Pico weather station project offers endless possibilities for expansion and customization. Consider adding data logging capabilities to record and analyze weather patterns over time. You can store the data on an SD card or transmit it wirelessly to a remote server for long-term storage and analysis.
Another exciting enhancement is creating a web dashboard to display your weather data in real-time. Use a web framework like Flask or Django to build an interactive interface that allows you to monitor your weather station from anywhere with an internet connection. You can even set up remote access to your Raspberry Pi Pico, enabling you to manage and maintain your weather station remotely.
Integrating your weather station with popular weather APIs, such as OpenWeatherMap or Weather Underground, can provide additional data points and enhance the accuracy of your measurements. By comparing your local data with regional forecasts, you can gain valuable insights into microclimatic variations and improve your understanding of the weather patterns in your area.
As you experiment and customize your Raspberry Pi Pico weather station, don’t be afraid to think outside the box. Add additional sensors to measure soil moisture, air quality, or even solar radiation. Incorporate machine learning algorithms to predict future weather conditions based on historical data. The possibilities are truly endless, and the only limit is your imagination.
Conclusion
Building a Raspberry Pi Pico weather station is a rewarding project that combines electronics, programming, and environmental monitoring. By following this guide, you’ve learned how to assemble the necessary components, write code to collect and display data, and deploy your weather station for real-world use. The Pico’s low cost, small size, and versatility make it an ideal platform for DIY projects like this one. With your new weather station, you can track temperature, humidity, and other conditions in your home, garden, or any location of interest. Feel free to customize and expand your project with additional sensors, displays, or connectivity options. We’d love to hear about your experiences and see your unique creations – share them with the Raspberry Pi community and inspire others to explore the exciting world of microcontroller projects!